Fig. 2.
Download original image
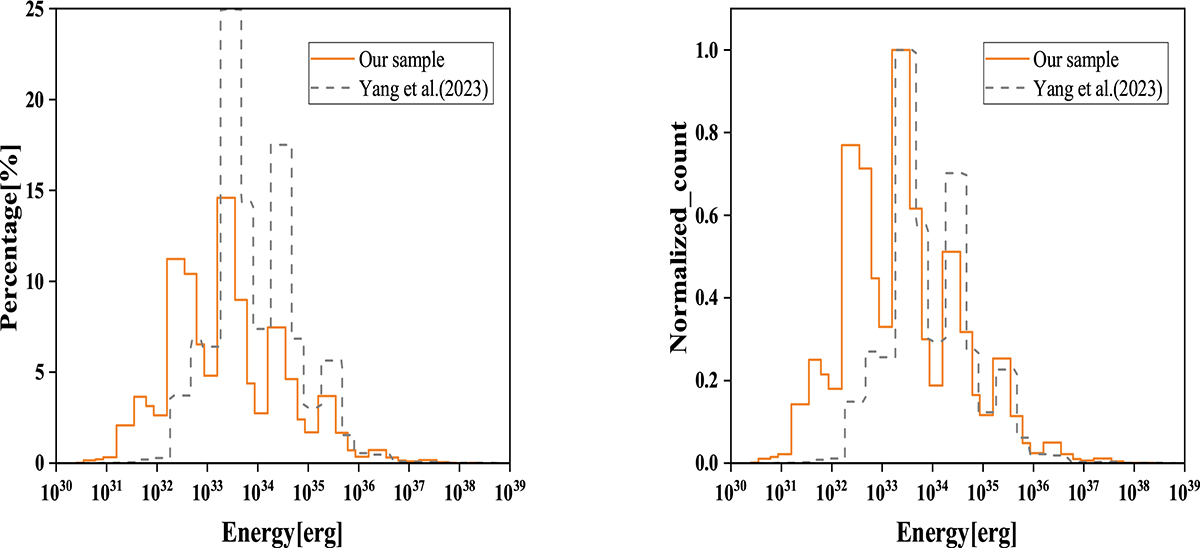
Percentage and normalized count of flare events in different flare energy intervals. Left: proportion of flare events within each energy range. Right: normalized value of the counts of flare events within each energy range shown. The orange lines show the distribution of the flare energy based on the TESS 20-second cadence data, and the dashed gray lines the TESS 2-minute cadence data (Yang et al. 2023).
Current usage metrics show cumulative count of Article Views (full-text article views including HTML views, PDF and ePub downloads, according to the available data) and Abstracts Views on Vision4Press platform.
Data correspond to usage on the plateform after 2015. The current usage metrics is available 48-96 hours after online publication and is updated daily on week days.
Initial download of the metrics may take a while.