Open Access
Fig. 13.
Download original image
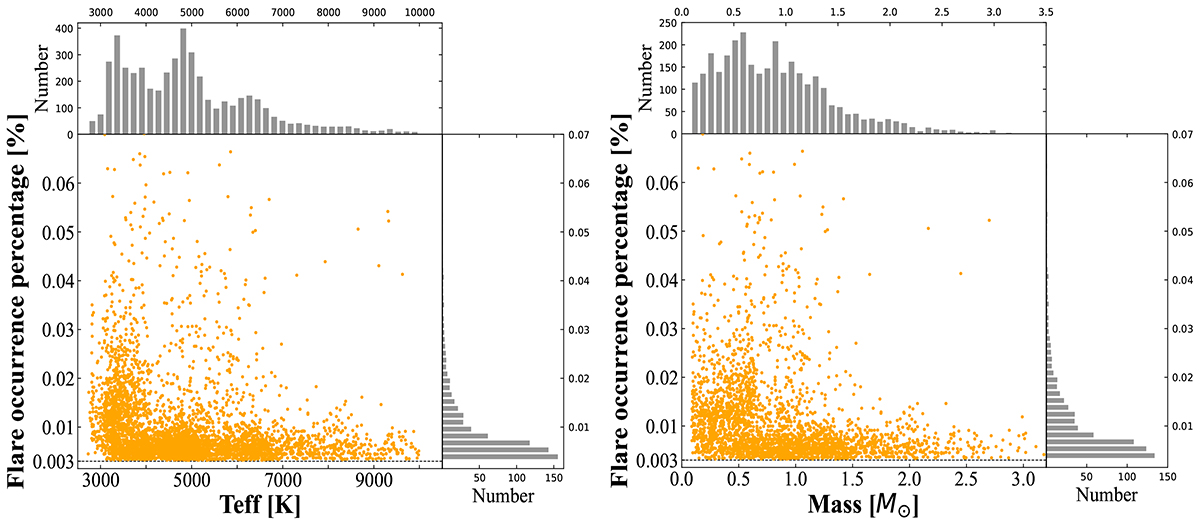
Relationships between the flare occurrence percentage and the stellar temperature (left panel) and the mass (right panel). The orange dots represent our sample distribution. The upper and right subpanels respectively show the histogram distribution of the probability and the temperature or mass of the flare.
Current usage metrics show cumulative count of Article Views (full-text article views including HTML views, PDF and ePub downloads, according to the available data) and Abstracts Views on Vision4Press platform.
Data correspond to usage on the plateform after 2015. The current usage metrics is available 48-96 hours after online publication and is updated daily on week days.
Initial download of the metrics may take a while.