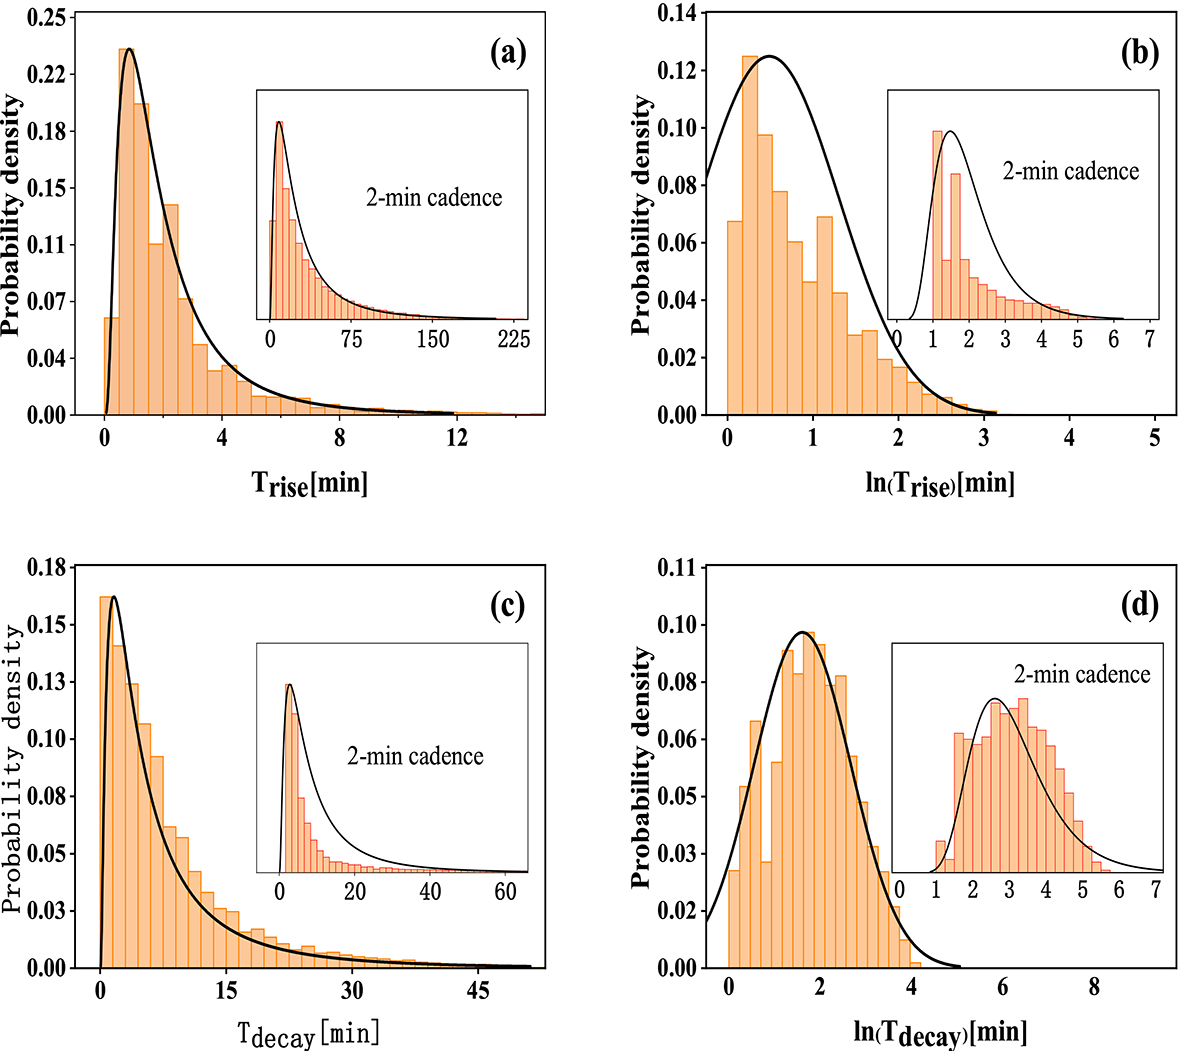
Fig. 10.
Download original image
Probability distributions of the rise (top panel) and decay times (bottom panel) based on 20-second data; the insets show the results based on TESS 2-minute data (Yang et al. 2023). The dark lines are their fittings of the bar graph. The left panel uses a decimal scale, and the right panel uses the corresponding log-normal values.
Current usage metrics show cumulative count of Article Views (full-text article views including HTML views, PDF and ePub downloads, according to the available data) and Abstracts Views on Vision4Press platform.
Data correspond to usage on the plateform after 2015. The current usage metrics is available 48-96 hours after online publication and is updated daily on week days.
Initial download of the metrics may take a while.