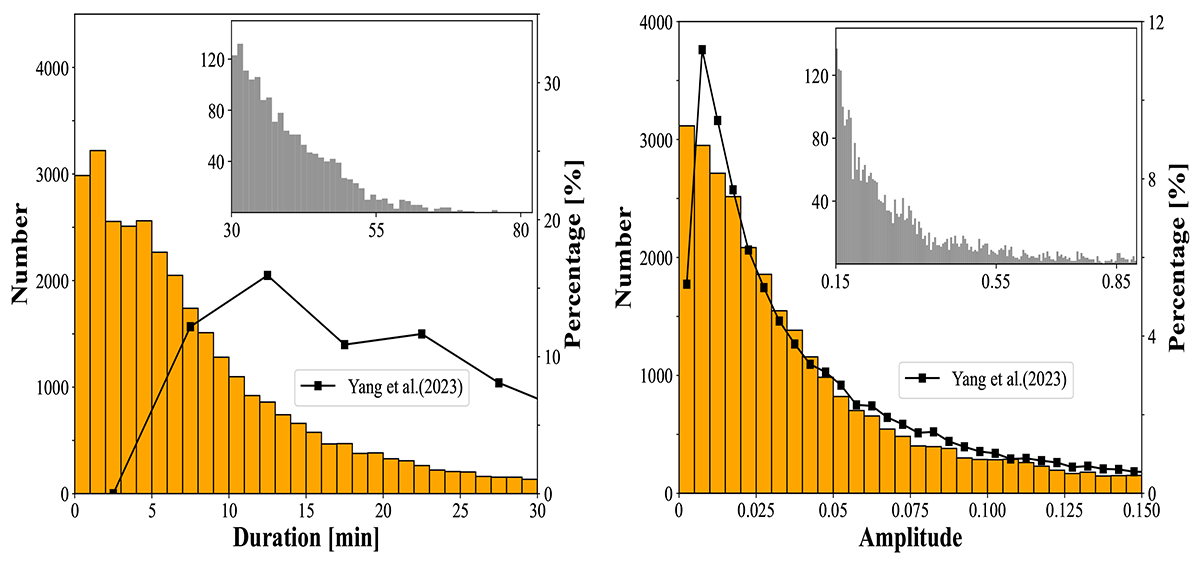
Fig. 1.
Download original image
Distributions of flare duration (left) and amplitude (right). The left vertical axes represent the number of flare events, and the right ones represent their corresponding proportions. The orange bars represent the main distribution of the flare duration (or amplitude) based on the TESS 20-second cadence data, while the remaining part of the distribution is shown with the gray bars in the inset. The black dotted line is the distribution of the flare numbers for the TESS 2-minute data (Yang et al. 2023). Due to the inability to search for flare events shorter than 6 minutes in the 2-minute cadence data, the first point’s value in the left panel is zero.
Current usage metrics show cumulative count of Article Views (full-text article views including HTML views, PDF and ePub downloads, according to the available data) and Abstracts Views on Vision4Press platform.
Data correspond to usage on the plateform after 2015. The current usage metrics is available 48-96 hours after online publication and is updated daily on week days.
Initial download of the metrics may take a while.