Fig. 9.
Download original image
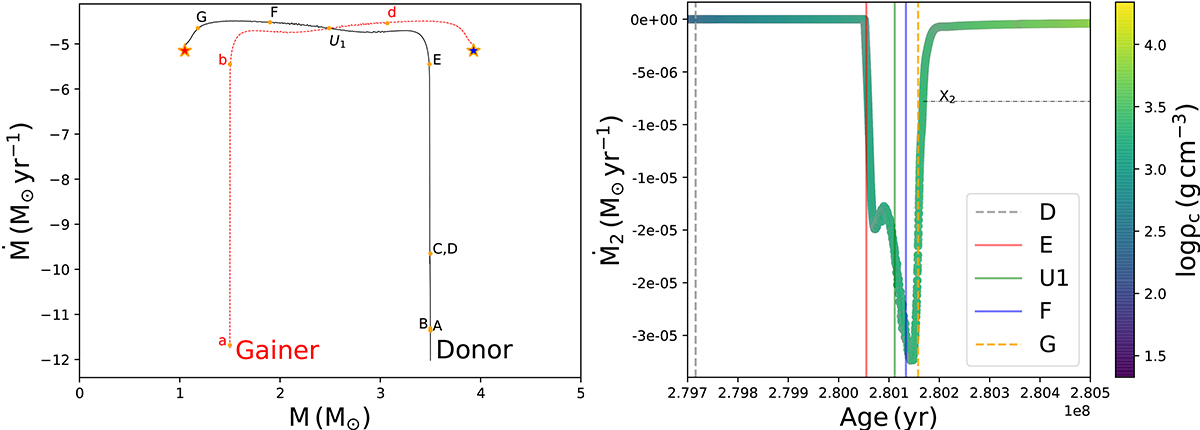
Theoretical variation in the mass transfer and Ṁd curve of the donor star. Left: theoretical variation in mass transfer until helium depletion is reached for initial masses Mi, d = 3.50 M⊙ and Mi, g = 1.50 M⊙, for an initial orbital period ![]() . Right: Ṁd curve for the best evolutionary model of the donor star measured in years. The vertical dashed gray line indicates the size increase beyond the RL due to depletion of 1H, the solid red line the initiation of mass transfer, the green line the mass inversion, the blue line the minimum RL value of the donor, and the dashed orange line the end of optically thick mass transfer from the donor to the gainer.
. Right: Ṁd curve for the best evolutionary model of the donor star measured in years. The vertical dashed gray line indicates the size increase beyond the RL due to depletion of 1H, the solid red line the initiation of mass transfer, the green line the mass inversion, the blue line the minimum RL value of the donor, and the dashed orange line the end of optically thick mass transfer from the donor to the gainer.
Current usage metrics show cumulative count of Article Views (full-text article views including HTML views, PDF and ePub downloads, according to the available data) and Abstracts Views on Vision4Press platform.
Data correspond to usage on the plateform after 2015. The current usage metrics is available 48-96 hours after online publication and is updated daily on week days.
Initial download of the metrics may take a while.