Fig. 6.
Download original image
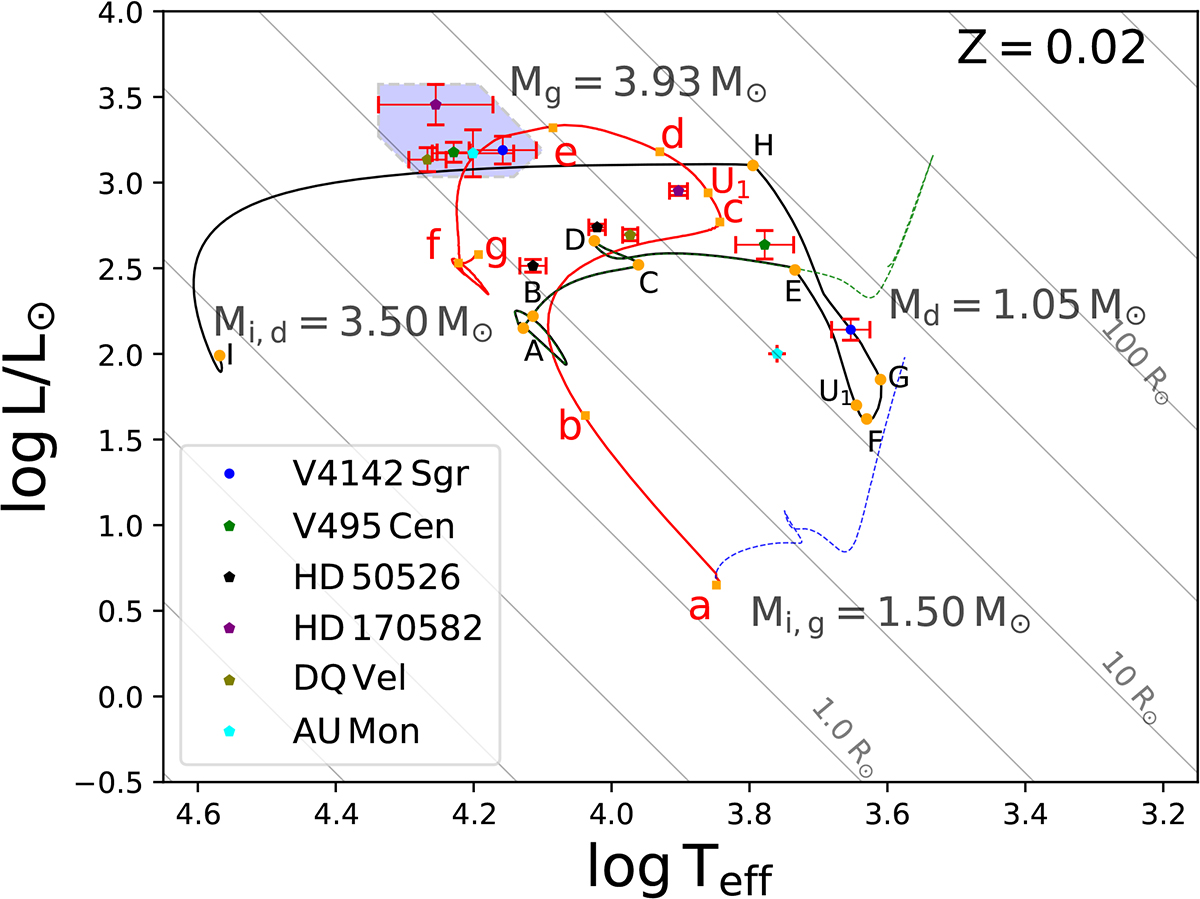
Evolutionary track of the DPV V4142 Sgr with a secondary star (black line) of initial mass Mi, d = 3.50 M⊙ and its companion (red line) of Mi, g = 1.50 M⊙. The dashed blue line represents the evolutionary track of a single star, identical to the initial mass of the gainer star, using the same initial parameters that were used to model the gainer, until central helium depletion (XHec < 0.2). The green line represents the evolutionary track for a single star, using the same donor initial parameters. The most important points during the evolution are labeled together with the initial and final theoretical masses. The blue zone represents the threshold of rejuvenated B-type stars. The uppercase black letters mark each stage of the donor star, while the lowercase red letters represent the stages of the gainer star (see Table 1).
Current usage metrics show cumulative count of Article Views (full-text article views including HTML views, PDF and ePub downloads, according to the available data) and Abstracts Views on Vision4Press platform.
Data correspond to usage on the plateform after 2015. The current usage metrics is available 48-96 hours after online publication and is updated daily on week days.
Initial download of the metrics may take a while.