Fig. 4.
Download original image
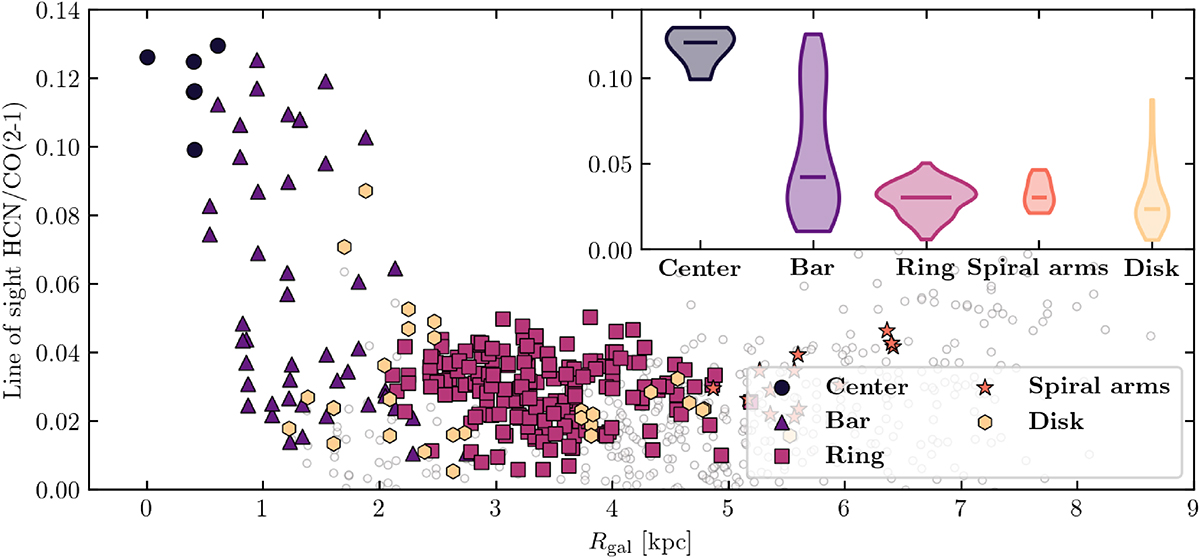
Radial distribution of the HCN/CO(2–1) intensity ratio across NGC 253. Sight lines are color-coded based on the environment. We show points with a signal-to-noise ratio above three in intensity and the peak brightness temperature. A small panel in this figure shows the distribution of the HCN/CO(2–1) line intensity ratio per environment in NGC 253: the center, bar, ring, spiral arms, and disk. The mean line ratio measured in each environment is shown as a horizontal line.
Current usage metrics show cumulative count of Article Views (full-text article views including HTML views, PDF and ePub downloads, according to the available data) and Abstracts Views on Vision4Press platform.
Data correspond to usage on the plateform after 2015. The current usage metrics is available 48-96 hours after online publication and is updated daily on week days.
Initial download of the metrics may take a while.