Fig. 2.
Download original image
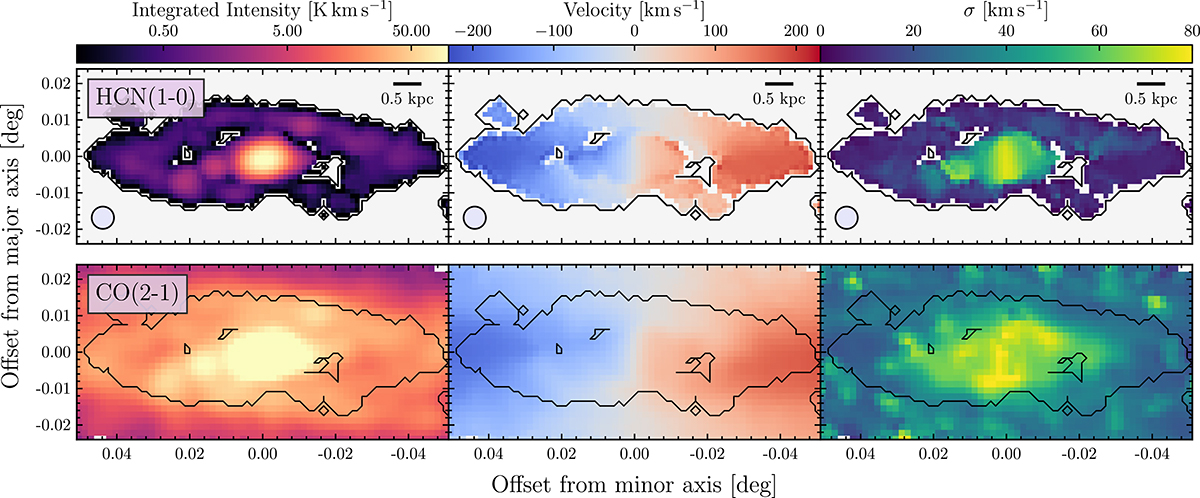
HCN and CO(2–1) moment maps. Top row: HCN(1–0) moment maps: integrated intensity map (left), centroid velocity map (middle), and velocity dispersion (right). The beam size of 22″ is shown in the left corner of each panel. Bottom row: CO(2–1) moment maps, in the same order as for HCN(1–0). CO(2–1) is convolved to a beam size of 22″, and regrided to match the grid of HCN data. The black line shows the outline of the HCN emission from the top panels. We fix the colorscale for each moment map to highlight the differences and similarities in HCN and CO(2–1) emission. All maps are rotated so that the x- and y-axis show the angular distance from the NGC 253’s minor and major axis (see Table 1).
Current usage metrics show cumulative count of Article Views (full-text article views including HTML views, PDF and ePub downloads, according to the available data) and Abstracts Views on Vision4Press platform.
Data correspond to usage on the plateform after 2015. The current usage metrics is available 48-96 hours after online publication and is updated daily on week days.
Initial download of the metrics may take a while.