Fig. 14.
Download original image
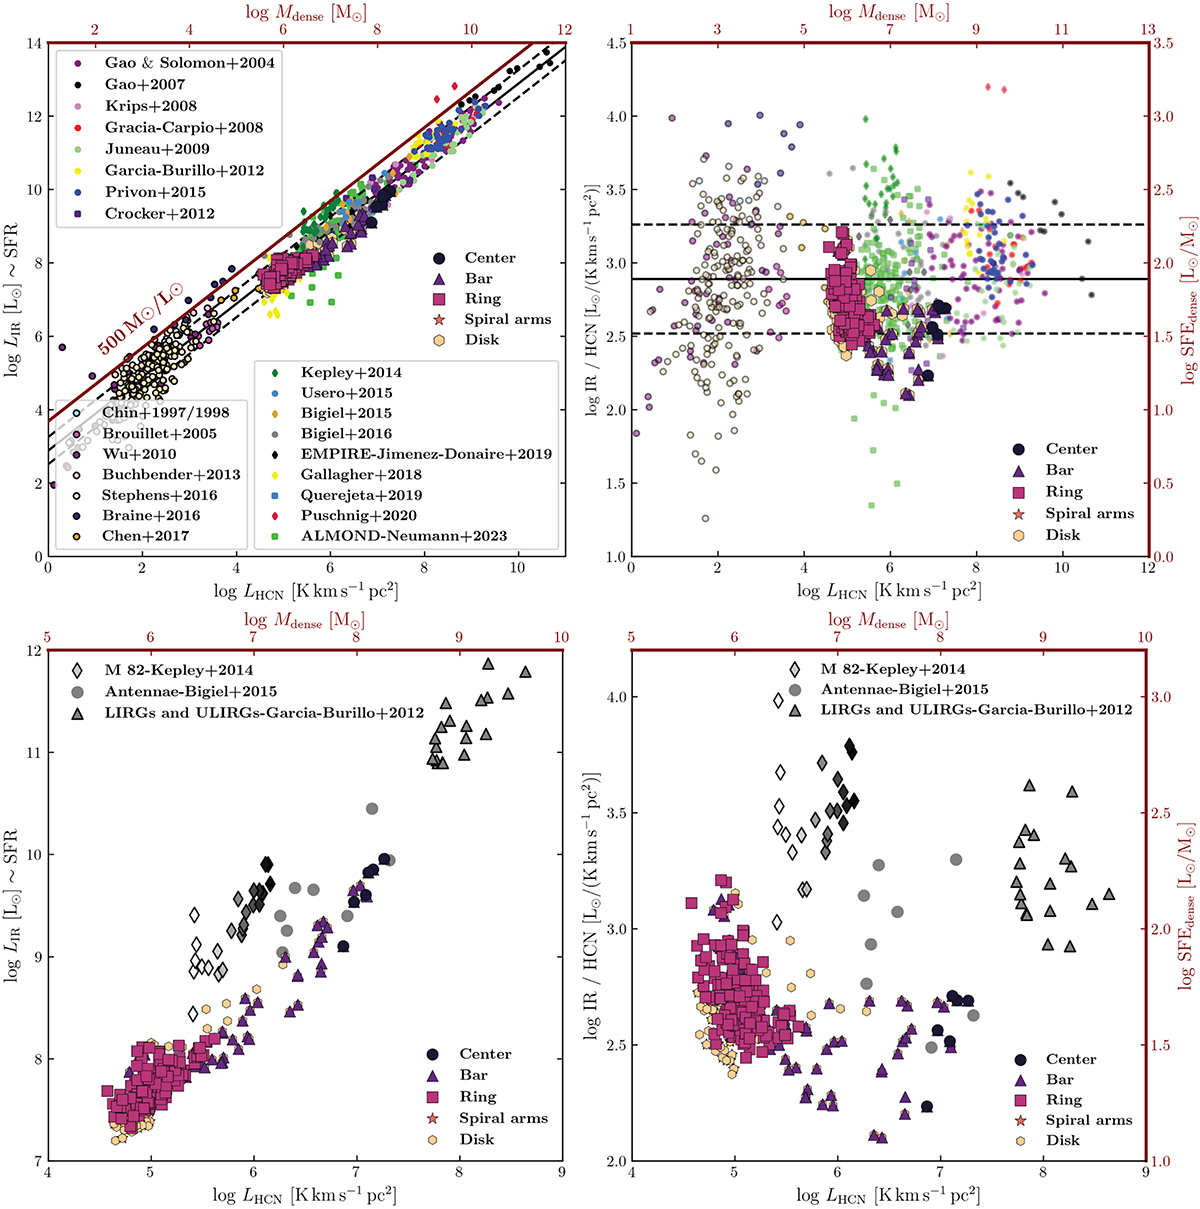
Summary of previous dense gas studies. Top left: literature overview of the infrared luminosity (a proxy for the star formation rate) as a function of the HCN luminosity (a proxy for dense molecular gas), that is, the Gao and Solomon relation (Gao & Solomon 2004). We show measurements of whole galaxies and their centers at a few kpcs (see the legend in the upper and the lower-left of the panel), Milky Way clouds (a few pc scales - see legend on the bottom right), including measurements across NGC 253 (this work - see the legend on the right central part) (Jiménez-Donaire et al. 2019). The dark red line shows a 500 M⊙/L⊙ which corresponds to a upper limit reported in Scoville & Wilson (2004) and Thompson et al. (2005). Top right: same as in the left panel, but we are now showing SFEdense, traced by the IR/HCN luminosity ratio on the y axis. In both panels, the black solid line shows the mean IR/HCN luminosity ratio measured by the EMPIRE survey (Jiménez-Donaire et al. 2019). Black dashed lines show the 1σ RMS scatter of ±0.37 dex in units of L⊙/(K km s−1 pc2). Bottom row: zoomed-in view of the field from Figure 14, where we show NGC 253 sight lines, points from the nearby starburst galaxy M 82 (Kepley et al. 2014), the merging system of the Antennae galaxies (Bigiel et al. 2015), and a sample of LIRGs and ULIRGs (García-Burillo et al. 2012). Axes are the same as of the panels at the top row. Data points from Kepley et al. (2014) have different shades of gray that corresponds to the distance to the center of M 82, where the darkest points have the smallest galactocentric distances.
Current usage metrics show cumulative count of Article Views (full-text article views including HTML views, PDF and ePub downloads, according to the available data) and Abstracts Views on Vision4Press platform.
Data correspond to usage on the plateform after 2015. The current usage metrics is available 48-96 hours after online publication and is updated daily on week days.
Initial download of the metrics may take a while.