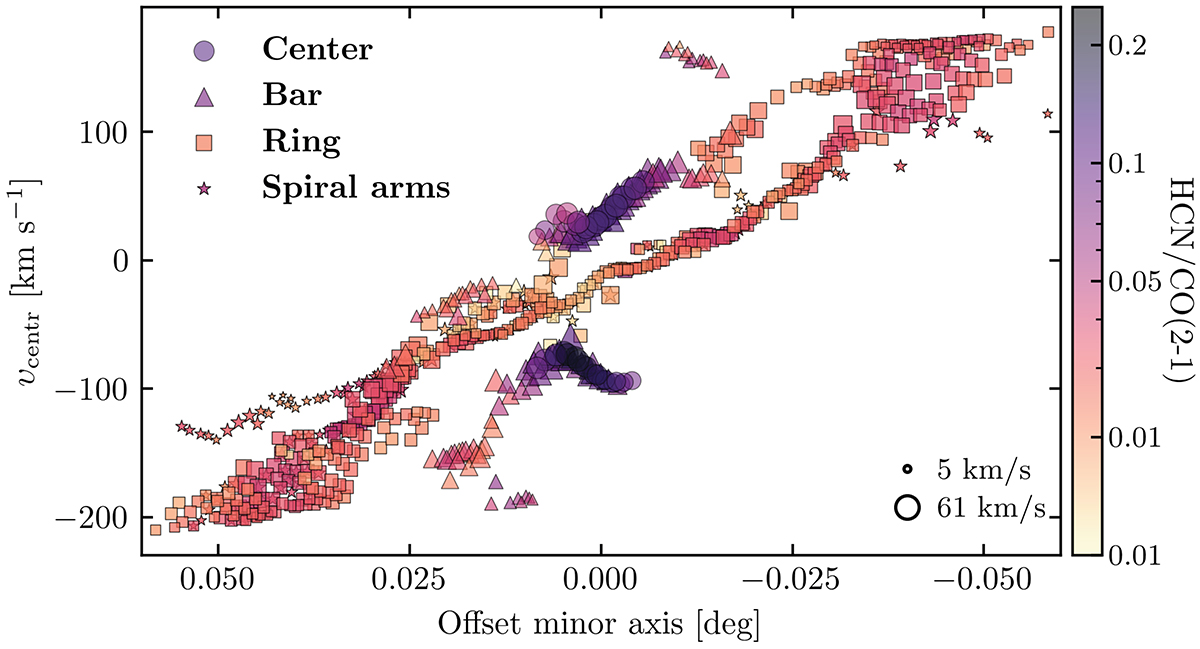
Fig. 13.
Download original image
Position–velocity diagram (pυ) of the HCN emission in NGC 253. The y-axis shows the centroid velocities from the spectral decomposition, and the x-axis shows the angular distances from the minor axis of NGC 253. We color-coded points by their HCN/CO(2–1) ratio derived from SCOUSE, and the size of each point corresponds to the HCN velocity dispersion.
Current usage metrics show cumulative count of Article Views (full-text article views including HTML views, PDF and ePub downloads, according to the available data) and Abstracts Views on Vision4Press platform.
Data correspond to usage on the plateform after 2015. The current usage metrics is available 48-96 hours after online publication and is updated daily on week days.
Initial download of the metrics may take a while.