Fig. 12.
Download original image
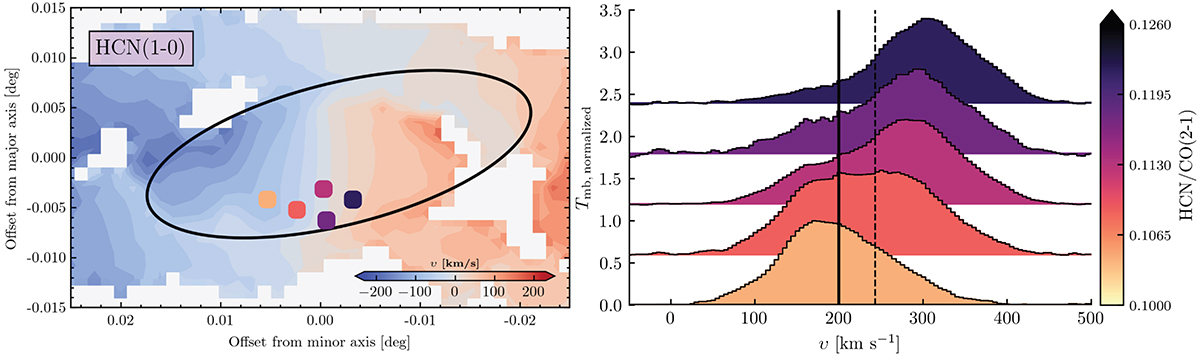
HCN spectrum taken along the minor axis. Left: bar sight lines in NGC 253. We label major and minor axes. Colored points are sight lines showing enhanced HCN/CO(2–1) emission in the direction of the SW streamer (Walter et al. 2017) and that contribute to the bimodality seen in Figure 4. Colors correspond to their HCN/CO(2–1) intensity ratio shown in the colorbar. Right: HCN spectra toward the data points located along the minor axis in NGC 253 shown on the left. Each spectrum is colored by the HCN/CO(2–1) ratio shown on the colorbar. All these data points are located along the SW streamer (Walter et al. 2017). The black dashed line shows NGC 253 systemic velocity of 243 km s−1 (see Table 1). The black solid line represents the υlsr = 200 km s−1 velocity at which Walter et al. (2017) observed the outflowing component in CO(1–0) emission.
Current usage metrics show cumulative count of Article Views (full-text article views including HTML views, PDF and ePub downloads, according to the available data) and Abstracts Views on Vision4Press platform.
Data correspond to usage on the plateform after 2015. The current usage metrics is available 48-96 hours after online publication and is updated daily on week days.
Initial download of the metrics may take a while.