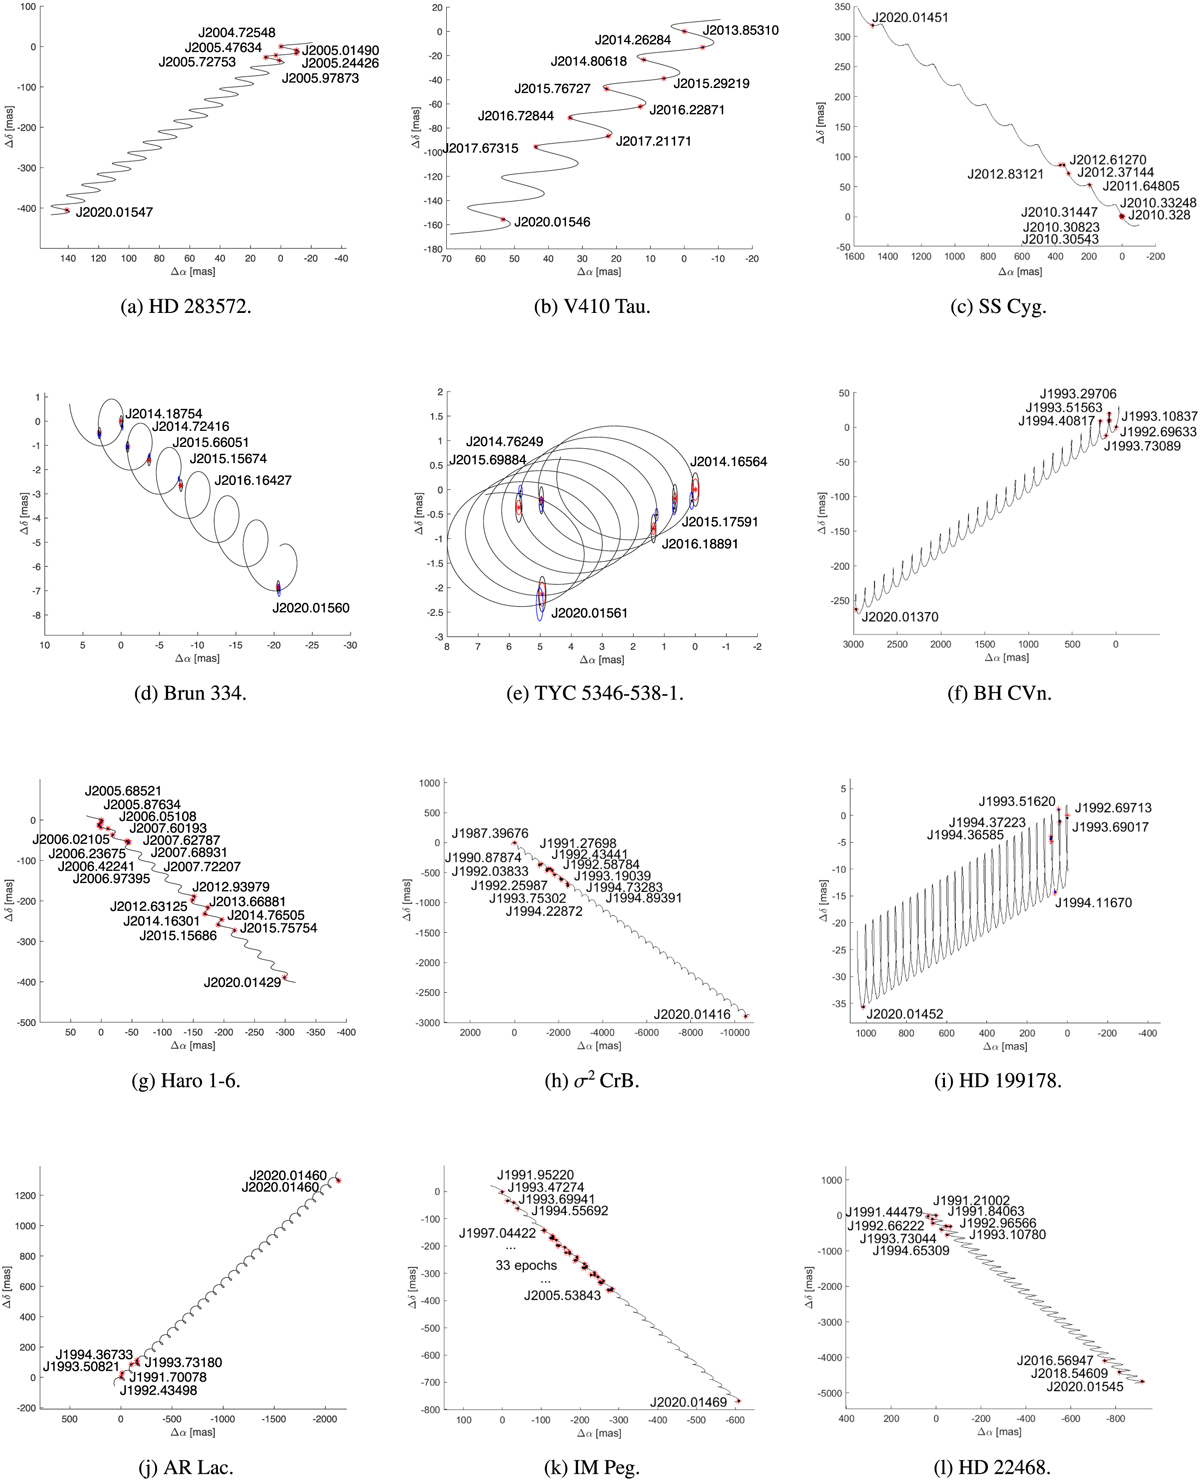
Fig. A.1
Download original image
Sky motion for the 15 stars with astrometric models reported in Table A.1. The observed positions are marked with the red stars and their uncertainties are visualized by the black ellipses. The adjusted positions are labeled by the black dots and their uncertainties by the blue ellipses. The model is indicated by a black line.
Current usage metrics show cumulative count of Article Views (full-text article views including HTML views, PDF and ePub downloads, according to the available data) and Abstracts Views on Vision4Press platform.
Data correspond to usage on the plateform after 2015. The current usage metrics is available 48-96 hours after online publication and is updated daily on week days.
Initial download of the metrics may take a while.