| Issue |
A&A
Volume 688, August 2024
|
|
|---|---|---|
| Article Number | L33 | |
| Number of page(s) | 5 | |
| Section | Letters to the Editor | |
| DOI | https://doi.org/10.1051/0004-6361/202451370 | |
| Published online | 23 August 2024 | |
Letter to the Editor
Intrinsic line profiles for X-ray fluorescent lines in SKIRT
1
Sterrenkundig Observatorium, Universiteit Gent, Krijgslaan 281 S9, 9000 Gent, Belgium
2
Institute of Space and Astronautical Science, Japan Aerospace Exploration Agency, Kanagawa 252-5210, Japan
3
Graduate School of Science and Engineering, Kagoshima University, Kagoshima 890-0065, Japan
4
Research Center for Space and Cosmic Evolution, Ehime University, Matsuyama 790-8577, Japan
5
Faculty of Science, Hokkaido University, Sapporo 060-0810, Japan
Received:
3
July
2024
Accepted:
4
August
2024
Abstract
Context. X-ray microcalorimeter instruments are expected to spectrally resolve the intrinsic line shapes of the strongest fluorescent lines. X-ray models should therefore incorporate these intrinsic line profiles to obtain meaningful constraints from observational data.
Aims. We included the intrinsic line profiles of the strongest fluorescent lines in the X-ray radiative transfer code SKIRT to model the cold-gas structure and kinematics based on high-resolution line observations from XRISM/Resolve and Athena/X-IFU.
Methods. The intrinsic line profiles of the Kα and Kβ lines of Cr, Mn, Fe, Co, Ni, and Cu were implemented based on a multi-Lorentzian parameterisation. Line energies are sampled from these Lorentzian components during the radiative transfer routine.
Results. In the optically thin regime, the SKIRT results match the intrinsic line profiles as measured in the laboratory. With a more complex 3D model that also includes kinematics, we find that the intrinsic line profiles are broadened and shifted to an extent that will be detectable with XRISM/Resolve; this model also demonstrates the importance of the intrinsic line shapes for constraining kinematics. We find that observed line profiles directly trace the cold-gas kinematics, without any additional radiative transfer effects.
Conclusions. With the advent of the first XRISM/Resolve data, this update to the X-ray radiative transfer framework of SKIRT is timely and provides a unique tool for constraining the velocity structure of cold gas from X-ray microcalorimeter spectra.
Key words: line: profiles / radiative transfer / methods: numerical / galaxies: nuclei / X-rays: binaries / X-rays: general
Corresponding author; This email address is being protected from spambots. You need JavaScript enabled to view it. .
© The Authors 2024
 Open Access article, published by EDP Sciences, under the terms of the Creative Commons Attribution License (https://creativecommons.org/licenses/by/4.0), which permits unrestricted use, distribution, and reproduction in any medium, provided the original work is properly cited.
This article is published in open access under the Subscribe to Open model. This email address is being protected from spambots. You need JavaScript enabled to view it. to support open access publication.
1. Introduction
Fluorescent lines are the most prominent tracers of X-ray reprocessing by cold atomic gas and can be observed in the X-ray spectra of active galactic nuclei (AGNs), X-ray binaries, and more (George & Fabian 1991; Matt et al. 1991; Nandra & Pounds 1994; Torrejón et al. 2010). These lines encode physical information about the reprocessing medium and are commonly used to constrain the structure of cold gas surrounding X-ray sources (Murphy & Yaqoob 2009; Ikeda et al. 2009; Brightman & Nandra 2011; Odaka et al. 2011; Liu & Li 2014; Paltani & Ricci 2017; Baloković et al. 2018; Buchner et al. 2019; Vander Meulen et al. 2023).
Fluorescent lines are produced when an inner-shell electron is ejected from a gas atom by the absorption of an X-ray photon. A higher-shell electron can fall into the inner-shell vacancy, emitting the energy difference as a fluorescent line. The strongest fluorescent lines correspond to the following K-shell transitions,
and are most prominently observed for abundant heavy metals, such as Fe and Ni, as the fluorescent yields increase along the atomic sequence. (Perkins et al. 1991).
The natural line shape for these bound-bound transitions (in energy space) is a Lorentzian (Agarwal 1979). The Kα doublet of most elements can be accurately represented with two Lorentzian sub-line components (Thomsen 1983), whereas Kβ lines often resemble a single Lorentzian due to the proximity of the Kβ1 and Kβ3 sub-lines (Perkins et al. 1991). However, for 3d transition elements (i.e. Sc to Zn), the Kα and Kβ sub-lines are significantly asymmetric due to multi-electron interactions inside the atom (Druyvesteyn 1927; Tsutsumi & Nakamori 1968; Doniach & Sunjic 1970; Finster et al. 1971; Deutsch et al. 1995).
With the advent of X-ray microcalorimeter instruments such as XRISM/Resolve (Tashiro et al. 2020) and Athena/X-IFU (Barret et al. 2018), the intrinsic line shapes of the strongest fluorescent lines (Fe Kα, Fe Kβ, Ni Kα, and more) are expected to be spectrally resolved (Smith et al. 2016; Mizumoto et al. 2022; Cucchetti et al. 2024; Kilbourne et al. 2024; Vaccaro et al. 2024). Therefore, X-ray spectral models should incorporate these line profiles in order to derive meaningful (velocity) constraints from observational data.
The intrinsic line shapes of the Kα and Kβ lines of Cr, Mn, Fe, Co, Ni, and Cu were measured in the laboratory by Hölzer et al. (1997) using a single-crystal diffractometer with a sub-part-per-million absolute-energy-scale accuracy. These data were presented alongside an analytical parameterisation for each of these lines, providing a convenient way to incorporate the line profiles into X-ray spectral models. Building on this parameterisation, the HEASARC calibration database1 (CALDB) listed a minor correction for the Mn Kα line based on onboard Hitomi/SXS calibration measurements (Eckart et al. 2016).
The intrinsic line profiles of the Fe Kα and Fe Kβ lines were recently implemented into MYTORUS (Yaqoob 2024). MYTORUS (Murphy & Yaqoob 2009) is an X-ray spectral model for absorption and reflection by a toroidal re-processor of cold atomic gas, which can be used to model the ‘AGN torus’. Yaqoob (2024) finds that the addition of these intrinsic line profiles is crucial for estimating the velocity broadening of the cold gas if the true velocity broadening is less than about 2000 km s−1.
This Letter reports on the implementation of the intrinsic line profiles of 12 fluorescent lines into the X-ray radiative transfer code SKIRT (Vander Meulen et al. 2023). SKIRT2 is a state-of-the-art Monte Carlo radiative transfer framework that is developed and maintained at Ghent University (Baes et al. 2003, 2011; Camps & Baes 2015, 2020). Recently, the SKIRT code was extended into the X-ray range to study the complex distribution of cold gas and dust around AGNs (Vander Meulen et al. 2023). SKIRT is optimised to operate in arbitrary 3D geometries with support for 3D kinematics and covers the X-ray to millimetre wavelength range self-consistently (Camps & Baes 2020; Gebek et al. 2023; Matsumoto et al. 2023). In the X-ray range, the SKIRT code models Compton scattering on free electrons, photo-absorption and (self-consistent) fluorescence by cold atomic gas, scattering on bound electrons, and extinction by dust. More details on the X-ray processes that are implemented in SKIRT are presented in Vander Meulen et al. (2023).
With the advent of the first XRISM/Resolve data, this update to the X-ray framework of SKIRT is timely and will be crucial for constraining the 3D density and velocity structure of cold gas from microcalorimeter X-ray spectra. The outline for this Letter is as follows: In Sect. 2 we present the implementation of the intrinsic line profiles. In Sect. 3 we compare the SKIRT simulation results to laboratory data. In Sect. 4 we demonstrate the capabilities of SKIRT to predict detailed line shapes from complex 3D models. We summarise our results and discuss their implications in Sect. 5.
2. Implementation
The intrinsic line profiles of the Kα and Kβ lines of Cr, Mn, Fe, Co, Ni, and Cu were measured by Hölzer et al. (1997), who provided an analytical parameterisation for each profile based on four to seven Lorentzian functions per line, which we adopted in SKIRT. The Lorentzian (i.e. Cauchy) probability density function is3
![Mathematical equation: $$ \begin{aligned} p(E) = I_i\,\,{\left[1 + \left(\frac{E-E_i}{W_i/2}\right)^2\right]}^{-1}, \end{aligned} $$](/articles/aa/full_html/2024/08/aa51370-24/aa51370-24-eq2.gif) (1)
(1)
with Ei being the photon energy of the line centre, Wi the full width at half maximum, and Ii the amplitude of the line. The integral (norm) of this function is Iint = π Ii Wi/2.
As the cumulative probability function of a Lorentzian can be analytically inverted, random photon energies can easily be generated from Eq. (1) through inverse transform sampling as
![Mathematical equation: $$ \begin{aligned} E = \frac{W_i}{2}\, \tan \left[ \pi \, \left(\chi - \frac{1}{2}\right)\right] +E_i, \end{aligned} $$](/articles/aa/full_html/2024/08/aa51370-24/aa51370-24-eq3.gif) (2)
(2)
with χ being a uniform deviate between 0 and 1.
The Ei, Wi, Ii, and Iint parameters of all Lorentzian sub-line components are taken from Hölzer et al. (1997) except for the Mn Kα sub-lines, which are taken from CALDB and include a minor correction to the Mn Kα line shape (Eckart et al. 2016). Furthermore, as the line integrals, Iint, of the Fe Kα22, Fe Kα23, and Co Kα14 sub-lines4 are not consistent with their amplitudes, Ii, we recalculated the Iint values based on the listed Ii and Wi parameters5 – a choice that is consistent with the experimental Fe Kα data shown in Fig. 1 of Hölzer et al. (1997). Finally, we normalised the Iint and Ii sub-line parameters so that each line (i.e. the sum of its sub-lines) has a total norm of 1.
While the Lorentzian sub-line components are merely part of an empirical parameterisation and do not represent any physical lines, they can be treated as individual lines in SKIRT, with an ‘artificial’ fluorescent yield of Yk, i = Iint × Yk, with Yk being the yield of the actual line (Perkins et al. 1991). In this way, most of the current implementation can be retained (see Vander Meulen et al. 2023), with one key difference: when a new Lorentzian sub-line (with yield Yk, i) is selected after a photo-absorption event, the corresponding line energy is no longer fixed (i.e. tabulated). Instead, a line energy must be sampled using Eq. (2), employing the sub-line parameters Ei and Wi that correspond to that specific Lorentzian sub-line. The main advantage of this approach is that line photons are traced individually, instead of propagating the line profile in its entirety, so radiative transfer effects on the line profile can be modelled (Sukhorukov & Leenaarts 2017). As the brightest lines are more frequently sampled (more photons are emitted in these lines), we naturally obtain high-signal-to-noise line profiles for the most prominent fluorescent lines. We do not find a significant difference in the simulation runtime with or without intrinsic line profiles.
3. Verification
To verify the implementation of the new intrinsic line profiles, we compared the simulation results of an optically thin SKIRT model (which ensures that the intrinsic line profiles are not altered by radiative transfer effects) to the laboratory data of Hölzer et al. (1997), which have been corrected for instrumental effects6. We considered a SKIRT model with a ring torus geometry of cold gas, centred on an X-ray point source (Γ = 1.8), which is observed at an inclination of 90°. We adopted an equatorial column density of NH = 1022 cm−2, which corresponds to a line-of-sight optical depth of τ < 4 × 10⁻² over the energy range of the strongest lines (i.e. 5.4–8.3 keV). We considered photo-absorption with Anders & Grevesse (1989) abundances and no dust as well as fluorescence and bound-electron scattering, and ran the simulation with 5 × 10⁹ photon packets.
Figure 1 shows the simulated line profiles of the six strongest fluorescent lines (in black), which are continuum-subtracted and normalised to an integrated line flux of 1. These SKIRT results are in excellent agreement with the intrinsic line profiles as measured in the laboratory (red), validating the SKIRT implementation and the data corrections discussed in Sect. 2. The asymmetries in the line profiles are evident from Fig. 1.
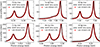 |
Fig. 1. Continuum-subtracted line profiles for the strongest fluorescent lines as obtained with SKIRT in the optically thin regime (black) compared to the laboratory data of Hölzer et al. (1997) (red), which have been corrected for instrumental broadening. We find an excellent agreement for all lines, verifying the SKIRT implementation and the data corrections that are described in Sect. 2. |
To verify the consistency of the new implementation with the previous SKIRT implementation (which assumed infinitely narrow lines), we used a benchmark described in Sect. 4.2.1. of Vander Meulen et al. (2023). This benchmark compares the SKIRT and MYTORUS (Murphy & Yaqoob 2009) codes, which is particularly useful as the intrinsic line profiles of Fe Kα and Fe Kβ are also implemented in MYTORUS7 (Yaqoob 2024). We reproduced the MYTORUS model in SKIRT with a uniform ring torus of cold gas, centred on an X-ray point source (Γ = 1.8). Mimicking the MYTORUS setup, we assumed free-electron scattering, Anders & Grevesse (1989) abundances, and no dust. We adopted an equatorial hydrogen column density of 1024 cm−2 and calculated the X-ray spectrum for an unobscured sightline (i = 45°). We specifically focused on the 6.0 to 7.5 keV range, which contains the three most prominent fluorescent lines (Fe Kα, Fe Kβ, and Ni Kα), and the Fe Kα Compton shoulder. The benchmark results are shown in Fig. 2.
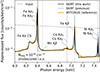 |
Fig. 2. Reprocessed photon flux for the benchmark model, representing an ‘AGN torus’. The new SKIRT implementation (black) is compared to the previous SKIRT implementation (blue) and to MYTORUS (yellow). |
Apart from the distinct Fe and Ni line shapes, we find that the Fe Kα Compton shoulder is now slightly smoother compared to the previous SKIRT implementation, which is predictable since the Fe Kα line is no longer sharply defined. Furthermore, we find that the high-energy tail of the Fe Kβ line extends to the Fe K absorption edge at 7.124 keV, which might complicate measurement of the absorbed continuum, especially when there is additional velocity broadening. The Fe Kβ line asymmetry is particularly prominent.
The reprocessed continuum level away from the extended lines is consistent with MYTORUS (see Fig. 2). We find a small discrepancy between 7.1 and 7.2 keV, which is related to the broader Fe K edge in the Compton-scattered continuum of MYTORUS. Furthermore, we find an excellent agreement between the Fe Kα and Fe Kβ line profiles as calculated with SKIRT and MYTORUS, whereas SKIRT does also predict a prominent Ni Kα line at ∼7.47 keV. We measured the line integrals of the Fe Kα, Fe Kβ, and Ni Kα lines as calculated with SKIRT and find that the line fluxes agree with the previous implementation within margins of 1%, 1%, and 3%, respectively. These minor differences likely arise from the continuum subtraction, which is now more ambiguous due to the extended line wings. Therefore, the new implementation is consistent with the previous SKIRT version and MYTORUS, while also incorporating intrinsic line profiles for 12 fluorescent lines, which has a significant effect on the X-ray spectrum between 6.0 and 7.5 keV.
4. Demonstration in 3D
We demonstrated the new capabilities of SKIRT to predict line profiles for complex 3D models (with kinematics) by post-processing the hydrodynamical ‘torus’ simulations of Wada et al. (2016), which represent the circumnuclear gas and dust around the nearby AGN in the Circinus galaxy. This spatial distribution of cold gas, as well as the corresponding velocity field, can be directly imported into SKIRT to form a truly 3D transfer medium.
In SKIRT, we adopted a central point source to illuminate the imported medium, with a power-law spectrum representative for the Circinus AGN (Γ = 1.8 and Ecut = 200 keV). We considered photo-absorption, fluorescence, and bound-electron scattering in the cold gas, with Anders & Grevesse (1989) abundances and no dust. We also imported the 3D distribution of hot electrons but find that these electrons have no observable effect on the X-ray spectrum as their densities are too low (log Ne < 22.9 for all sightlines). In this Letter, we focus on the shape of the Fe Kα line. In future work we will present more details on the X-ray post-processing of this radiation-driven fountain model with SKIRT, and an in-depth study of the X-ray observables.
The right-hand panel of Fig. 3 shows the normalised Fe Kα line profiles as calculated with SKIRT for different inclination angles. The corresponding line-of-sight NH is given in the legend. In the left-hand panel, the broadband X-ray spectrum and a red-green-blue X-ray image at i = 90° are shown as an illustration. The Fe Kα line profiles (i < 90°) are clearly affected by velocity broadening, to an extent that should be detectable with XRISM/Resolve (Kilbourne et al. 2024). Yet, the observed line widths are still primarily dominated by the intrinsic line profile (dotted line), which demonstrates that these velocity measurements can only be viable when the intrinsic line profiles are taken into account.
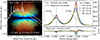 |
Fig. 3. SKIRT radiative transfer modelling of the Fe Kα line in the radiation-driven fountain model of Wada et al. (2016), representing the cold gas around the Circinus AGN. Right: Normalised Fe Kα line profiles for different inclinations. The velocity broadening of the Fe Kα line is significant and can only be modelled when the intrinsic line profiles are taken into account. Left: Broadband spectrum and red-green-blue image for i = 90°. |
The velocity broadening of the Fe Kα lines is consistent with the Keplerian velocity of the innermost region of the equatorial torus. Indeed, by imaging the Fe Kα line, we confirm that most of the line photons originate from this inner region. As a result, the line width as a function of inclination, which increases from i = 0° to i = 60°, can be explained by the projected velocity of the equatorial gas (Fig. 3). At i = 90°, the inner high-velocity component of the torus is completely obscured, resulting in a narrow line profile that is mostly produced by cold gas in the polar region (see Fig. 3, left). We note that the double-horn signature associated with the Keplerian rotation of the line-emitting gas is completely washed out by the relatively broad intrinsic line profile.
In addition to this velocity broadening, the Fe Kα line peaks are slightly redshifted (up to 0.4 eV), which traces the asymmetric obscuration of the inner flow. This is further complicated by the presence of radiation-driven outflows, failed winds, and the asymmetry of the intrinsic line profile. These velocity shifts could be detected with XRISM/Resolve, which might achieve a line centroid accuracy of about 0.1 eV (at best), as evidenced by observations of the onboard 55Fe calibration source (Miller 2024; Williams 2024). The line profile for i = 90° could be particularly interesting, as the inner obscuring disc of the Circinus AGN might be close to edge-on (see e.g. Stalevski et al. 2017, 2019; Uematsu et al. 2021; Ogawa et al. 2022). In this case, we predict an Fe Kα line with minimal broadening relative to the intrinsic line profile, which is mostly emitted from the polar regions and can be characterised with XRISM/Resolve.
Finally, we investigated the direct8 effect of radiative transfer processes on the observed line profiles by re-running the SKIRT post-processing procedure without any kinematics. This time, we find that the simulated line profiles cannot be distinguished from the intrinsic line profile, which demonstrates that radiative transfer processes such as photo-absorption and bound-electron scattering do not (directly) affect the observed line shapes. This was predictable since the energy dependence of the absorption and scattering cross-sections is negligible over the energy range of a single line (Vander Meulen et al. 2023), while inelastic (bound-)Compton scattering produces spectral features on energy scales that are much more extended than the line profile (see for example the Fe and Ni Compton shoulders in Fig. 2). However, we note that 3D radiative transfer simulations remain essential for predicting the fluorescent line strengths (together with the reprocessed continuum) and for self-consistently incorporating the 3D kinematics into the radiative transfer results.
For the same reason, the effect of dust cannot be observed in the Fe Kα line profile. The energy dependence of the dust extinction cross-sections is negligible over the energy range of a single line (Vander Meulen et al. 2023), while atoms locked in dust grains cannot contribute more than 0.35% to the total bound-electron scattering (i.e. when all Si atoms are locked in dust grains; for a dust-to-metal mass ratio of 0.3, see Sect. 3.3.1. of Vander Meulen et al. 2023). Finally, Ricci & Paltani (2023) demonstrate that the isotropy of fluorescence is not disturbed via self-absorption in solid dust grains. We experimented with various dust fractions in SKIRT but find no observable effect on the (normalised) Fe Kα line profile.
We find that the Fe Kα line width is primarily caused by intrinsic broadening, with some additional broadening due to the gas kinematics. Next, we considered any further broadening that could be caused by the mixing of Kα lines of different Fe ions, as opposed to the fully neutral Fe that is adopted in SKIRT. We estimated the charge state distribution of Fe as a function of the ionisation parameter, ξ, using XSTAR (Kallman et al. 2004) and calculated the total observed Fe Kα line centroid and its spread based on the ion line energies quoted in Yamaguchi et al. (2014). Up to ξ = 10 erg cm s−1, the line broadening due to the mixing of quasi-neutral Fe Kα lines is less than 5 eV, while it would be less than 0.5 eV for ξ < 1 erg cm s−1. For the 3D torus model by Wada et al. (2016), the radiation-driven gas has an ionisation parameter ξ < 1 erg cm s−1, whereas ξ < 10−4 erg cm s−1 for the dense equatorial disc producing most of the Fe Kα line photons (Ogawa et al. 2022). Therefore, this broadening would be less than 0.5 eV (i.e. below the 5 eV resolution of XRISM/Resolve) and can be safely neglected.
5. Summary and outlook
This Letter reports on the implementation of the intrinsic line profiles of 12 fluorescent lines into the 3D radiative transfer code SKIRT (Sect. 2) and presents the Fe Kα line profiles for a 3D torus model that also includes kinematics (Sect. 4).
We find that the SKIRT results in the optically thin regime match the intrinsic line profiles as measured in the laboratory (Fig. 1), and we confirm the consistency of the new results with the previous SKIRT implementation, away from these lines (Fig. 2). This comparison further highlights the importance of the new line profiles, with prominent Fe Kα, Fe Kβ, and Ni Kα lines showing their extended, asymmetric line wings and a smoothed Fe Kα Compton shoulder (Fig. 2).
In Sect. 4 we study the formation of Fe Kα line profiles in the 3D AGN torus model of Wada et al. (2016), which also includes kinematics. We find that the intrinsic line profiles are broadened and shifted to an extent that should be detectable with XRISM/Resolve (Fig. 3), while also demonstrating that the observed line profiles are still dominated by the intrinsic Fe Kα profile. We conclude that velocity measurements on fluorescent lines are only viable when the intrinsic line profiles are taken into account. Finally, we find that the fluorescent line profiles directly trace the cold-gas kinematics without being affected by photo-absorption or (bound-)Compton scattering.
To our knowledge, there is no other publicly available X-ray radiative transfer framework with sufficient flexibility that can model the effect of 3D velocities during the radiative transfer routine such that gas kinematics are self-consistently incorporated into the simulation results (as opposed to some smoothing in post-processing). Therefore, the SKIRT code could constitute a unique tool for studying the kinematics of cold gas through X-ray spectroscopy now that the intrinsic line profiles of the strongest fluorescent lines are properly incorporated into the code.
With the advent of the first XRISM/Resolve data, this update to the X-ray framework of SKIRT is timely and will be crucial for constraining the 3D density and velocity structure of cold gas from X-ray microcalorimeter spectra. The SKIRT code is publicly available and well documented9, and the community is warmly invited to use the code in any way they see fit.
Equation (1) of Hölzer et al. (1997) is missing the factor 1/2.
This is also true for the Mn Kα15 and Mn Kα22 sub-line parameters as listed in Hölzer et al. (1997), but they are not used in this work.
These differences are likely not observable with XRISM/Resolve.
For Mn Kα, we used the CALDB data based on Eckart et al. (2016).
The direct effect of the radiative transfer interactions, as opposed to the effect of the Doppler shifts that are applied at each interaction.
Acknowledgments
We wish to thank the anonymous referee for their careful reading and constructive comments. B. V. acknowledges support by the Fund for Scientific Research Flanders (FWO-Vlaanderen, project 11H2121N). Numerical computations were carried out on Cray XC50 at Center for Computational Astrophysics, National Astronomical Observatory of Japan. This work is supported by the Japan Society for the Promotion of Science (JSPS) KAKENHI grant No. JP21H04496 (K. W.).
References
- Agarwal, B. K. 1979, X-ray Spectroscopy: An Introduction (Springer) [Google Scholar]
- Anders, E., & Grevesse, N. 1989, Geochim. Cosmochim. Acta, 53, 197 [Google Scholar]
- Baes, M., Davies, J. I., Dejonghe, H., et al. 2003, MNRAS, 343, 1081 [NASA ADS] [CrossRef] [Google Scholar]
- Baes, M., Verstappen, J., De Looze, I., et al. 2011, ApJS, 196, 22 [Google Scholar]
- Baloković, M., Brightman, M., Harrison, F. A., et al. 2018, ApJ, 854, 42 [Google Scholar]
- Barret, D., Lam Trong, T., den Herder, J.-W., et al. 2018, SPIE Conf. Ser., 10699, 106991G [Google Scholar]
- Brightman, M., & Nandra, K. 2011, MNRAS, 413, 1206 [NASA ADS] [CrossRef] [Google Scholar]
- Buchner, J., Brightman, M., Nandra, K., Nikutta, R., & Bauer, F. E. 2019, A&A, 629, A16 [NASA ADS] [CrossRef] [EDP Sciences] [Google Scholar]
- Camps, P., & Baes, M. 2015, Astron. Comput., 9, 20 [Google Scholar]
- Camps, P., & Baes, M. 2020, Astron. Comput., 31, 100381 [NASA ADS] [CrossRef] [Google Scholar]
- Cucchetti, E., Smith, S. J., Witthoeft, M. C., et al. 2024, J. Low Temp. Phys., 216, 292 [CrossRef] [Google Scholar]
- Deutsch, M., Hölzer, G., Härtwig, J., et al. 1995, Phys. Rev. A, 51, 283 [NASA ADS] [CrossRef] [Google Scholar]
- Doniach, S., & Sunjic, M. 1970, J. Phys. C Solid State Phys., 3, 285 [Google Scholar]
- Druyvesteyn, M. J. 1927, Z. Astrophys., 43, 707 [Google Scholar]
- Eckart, M., Kilbourne, C., & Porter, F. S. 2016, Instrument Calibration Report - Natural Line Shapes of SXS Onboard Calibration Sources - ASTH-SXS-CALDBLINEFIT, Version 0.2, 19 October 2016, Tech. rep., ISAS/GSFC [Google Scholar]
- Finster, J., Leonhardt, G., & Meisel, A. 1971, Le Journal de Physique Colloques, 32, C4 [Google Scholar]
- Gebek, A., Baes, M., Diemer, B., et al. 2023, MNRAS, 521, 5645 [NASA ADS] [CrossRef] [Google Scholar]
- George, I. M., & Fabian, A. C. 1991, MNRAS, 249, 352 [Google Scholar]
- Hölzer, G., Fritsch, M., Deutsch, M., Härtwig, J., & Förster, E. 1997, Phys. Rev. A, 56, 4554 [CrossRef] [Google Scholar]
- Ikeda, S., Awaki, H., & Terashima, Y. 2009, ApJ, 692, 608 [Google Scholar]
- Kallman, T. R., Palmeri, P., Bautista, M. A., Mendoza, C., & Krolik, J. H. 2004, ApJS, 155, 675 [Google Scholar]
- Kilbourne, C., Chiao, M., Costantini, E., et al. 2024, AAS/High Energy Astrophys. Div., 21, 303.04 [Google Scholar]
- Liu, Y., & Li, X. 2014, ApJ, 787, 52 [NASA ADS] [CrossRef] [Google Scholar]
- Matsumoto, K., Camps, P., Baes, M., et al. 2023, A&A, 678, A175 [NASA ADS] [CrossRef] [EDP Sciences] [Google Scholar]
- Matt, G., Perola, G. C., & Piro, L. 1991, A&A, 247, 25 [NASA ADS] [Google Scholar]
- Miller, E. 2024, AAS Meet. Abstr., 243, 117.02 [NASA ADS] [Google Scholar]
- Mizumoto, M., Tsujimoto, M., Cumbee, R. S., et al. 2022, SPIE Conf. Ser., 12181, 121815Z [NASA ADS] [Google Scholar]
- Murphy, K. D., & Yaqoob, T. 2009, MNRAS, 397, 1549 [Google Scholar]
- Nandra, K., & Pounds, K. A. 1994, MNRAS, 268, 405 [Google Scholar]
- Odaka, H., Aharonian, F., Watanabe, S., et al. 2011, ApJ, 740, 103 [NASA ADS] [CrossRef] [Google Scholar]
- Ogawa, S., Ueda, Y., Wada, K., & Mizumoto, M. 2022, ApJ, 925, 55 [NASA ADS] [CrossRef] [Google Scholar]
- Paltani, S., & Ricci, C. 2017, A&A, 607, A31 [NASA ADS] [CrossRef] [EDP Sciences] [Google Scholar]
- Perkins, S. T., Cullen, D. E., & Seltzer, S. M. 1991, Tablesand graphs of electron-interaction cross sections from 10 eV to 100GeV derived from the LLNL Evaluated Electron Data Library (EEDL), Z = 1 to 100, Lawrence Livermore National Lab., CA (United States). Technical Report UCRL-50400-Vol.31. DOE contract W-7405-ENG-48 [Google Scholar]
- Ricci, C., & Paltani, S. 2023, ApJ, 945, 55 [NASA ADS] [CrossRef] [Google Scholar]
- Smith, S. J., Adams, J. S., Bandler, S. R., et al. 2016, SPIE Conf. Ser., 9905, 99052H [NASA ADS] [Google Scholar]
- Stalevski, M., Asmus, D., & Tristram, K. R. W. 2017, MNRAS, 472, 3854 [NASA ADS] [CrossRef] [Google Scholar]
- Stalevski, M., Tristram, K. R. W., & Asmus, D. 2019, MNRAS, 484, 3334 [NASA ADS] [CrossRef] [Google Scholar]
- Sukhorukov, A. V., & Leenaarts, J. 2017, A&A, 597, A46 [NASA ADS] [CrossRef] [EDP Sciences] [Google Scholar]
- Tashiro, M., Maejima, H., Toda, K., et al. 2020, SPIE Conf. Ser., 11444, 1144422 [Google Scholar]
- Thomsen, J. 1983, J. Phys. B: At. Mol. Phys., 16, 1171 [CrossRef] [Google Scholar]
- Torrejón, J. M., Schulz, N. S., Nowak, M. A., & Kallman, T. R. 2010, ApJ, 715, 947 [CrossRef] [Google Scholar]
- Tsutsumi, K., & Nakamori, H. 1968, J. Phys. Soc. Jpn., 25, 1418 [Google Scholar]
- Uematsu, R., Ueda, Y., Tanimoto, A., et al. 2021, ApJ, 913, 17 [Google Scholar]
- Vaccaro, D., Akamatsu, H., Gottardi, L., et al. 2024, J. Low Temp. Phys., 216, 21 [CrossRef] [Google Scholar]
- Vander Meulen, B., Camps, P., Stalevski, M., & Baes, M. 2023, A&A, 674, A123 [NASA ADS] [CrossRef] [EDP Sciences] [Google Scholar]
- Wada, K., Schartmann, M., & Meijerink, R. 2016, ApJ, 828, L19 [Google Scholar]
- Williams, B. 2024, AAS/High Energy Astrophys. Div., 21, 303.02 [Google Scholar]
- Yamaguchi, H., Eriksen, K. A., Badenes, C., et al. 2014, ApJ, 780, 136 [Google Scholar]
- Yaqoob, T. 2024, MNRAS, 527, 1093 [Google Scholar]
All Figures
|
Fig. 1. Continuum-subtracted line profiles for the strongest fluorescent lines as obtained with SKIRT in the optically thin regime (black) compared to the laboratory data of Hölzer et al. (1997) (red), which have been corrected for instrumental broadening. We find an excellent agreement for all lines, verifying the SKIRT implementation and the data corrections that are described in Sect. 2. |
| In the text | |
|
Fig. 2. Reprocessed photon flux for the benchmark model, representing an ‘AGN torus’. The new SKIRT implementation (black) is compared to the previous SKIRT implementation (blue) and to MYTORUS (yellow). |
| In the text | |
|
Fig. 3. SKIRT radiative transfer modelling of the Fe Kα line in the radiation-driven fountain model of Wada et al. (2016), representing the cold gas around the Circinus AGN. Right: Normalised Fe Kα line profiles for different inclinations. The velocity broadening of the Fe Kα line is significant and can only be modelled when the intrinsic line profiles are taken into account. Left: Broadband spectrum and red-green-blue image for i = 90°. |
| In the text | |
Current usage metrics show cumulative count of Article Views (full-text article views including HTML views, PDF and ePub downloads, according to the available data) and Abstracts Views on Vision4Press platform.
Data correspond to usage on the plateform after 2015. The current usage metrics is available 48-96 hours after online publication and is updated daily on week days.
Initial download of the metrics may take a while.