Open Access
Fig. 4.
Download original image
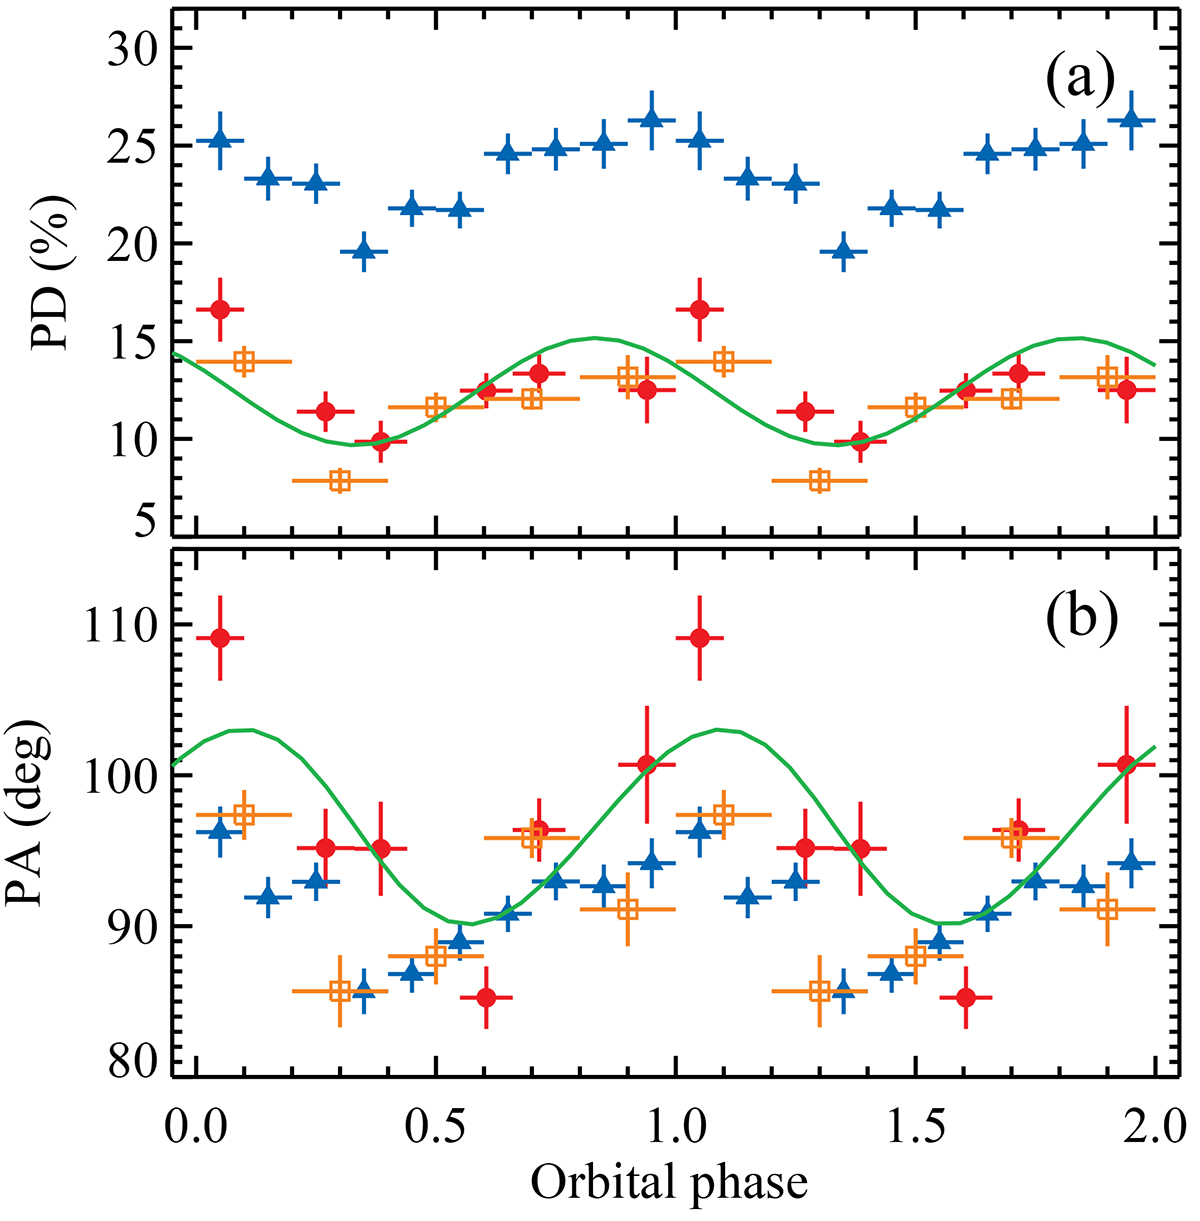
Orbital phase dependence of the PD and PA from the hard state (blue triangles), the intermediate state (orange open squares), and ultrasoft state (red circles). The green lines show the best-fit rotating vector model (Appendix C) to the ultrasoft-state data.
Current usage metrics show cumulative count of Article Views (full-text article views including HTML views, PDF and ePub downloads, according to the available data) and Abstracts Views on Vision4Press platform.
Data correspond to usage on the plateform after 2015. The current usage metrics is available 48-96 hours after online publication and is updated daily on week days.
Initial download of the metrics may take a while.