Open Access
Fig. B.1.
Download original image
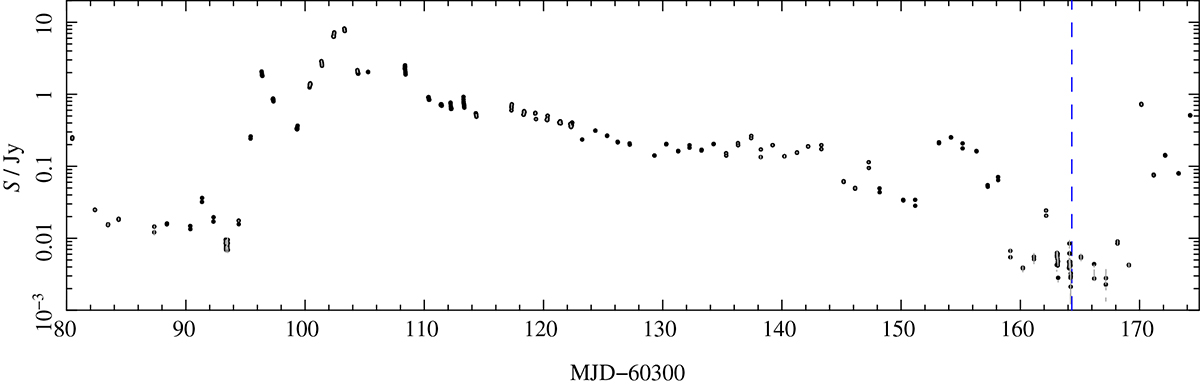
AMI observations of Cyg X-3 at 15 GHz from early March to mid-June 2024. Each point is the average flux density in a 10 min bin, with an error bar giving the statistical error. The dashed blue line indicates the IXPE observation date.
Current usage metrics show cumulative count of Article Views (full-text article views including HTML views, PDF and ePub downloads, according to the available data) and Abstracts Views on Vision4Press platform.
Data correspond to usage on the plateform after 2015. The current usage metrics is available 48-96 hours after online publication and is updated daily on week days.
Initial download of the metrics may take a while.