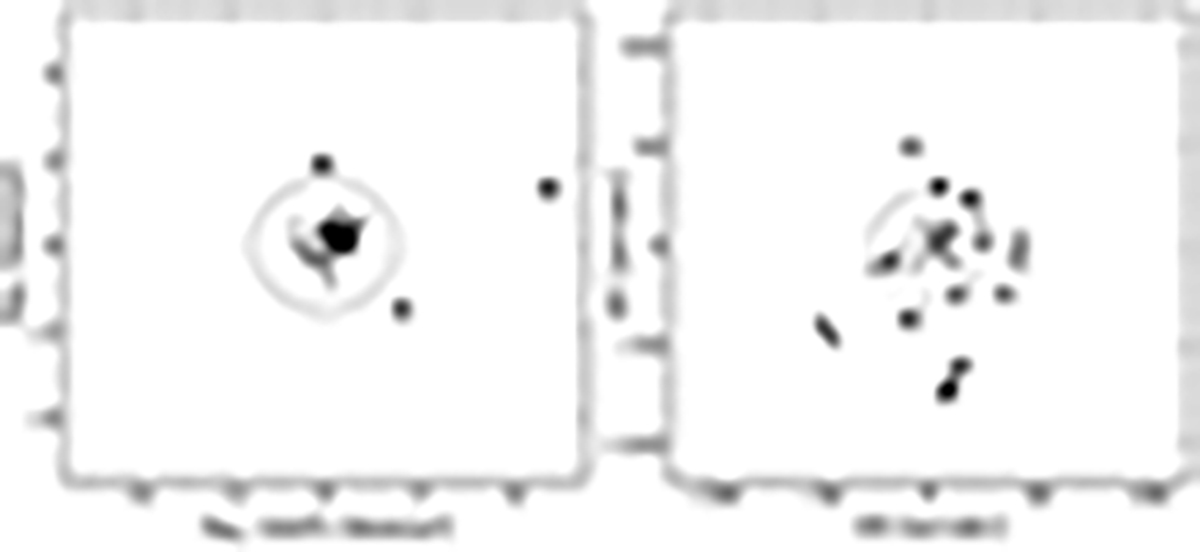
Fig. 2.
Download original image
Kinematic and spatial location of the observed stars. Left panel: vector point diagram of the 30 observed stars showing the α and δ components of the measured HST PMs referred to the systemic value (μα cos δ = −4.979 mas yr−1, μδ = −7.431 mas yr−1) quoted by Vasiliev & Baumgardt (2021). The large dashed circle is centered on (0, 0) and has a radius equal to 3 × σPM, with σPM = 0.5 mas yr−1 being the measured dispersion of the PM distribution for the Terzan 6 bright stars. The three stars beyond this circle (marked with a cross) are considered as field interlopers. Right panel: distribution of the observed stars in the plane of the sky with respect to the cluster center (same symbols as in the left panel). A consistent fraction of them lie within the dashed circle marking the cluster half-light radius of 26.4″, while the remaining stars lie well within the tidal radius (see, e.g., Harris 1996).
Current usage metrics show cumulative count of Article Views (full-text article views including HTML views, PDF and ePub downloads, according to the available data) and Abstracts Views on Vision4Press platform.
Data correspond to usage on the plateform after 2015. The current usage metrics is available 48-96 hours after online publication and is updated daily on week days.
Initial download of the metrics may take a while.