Fig. 8
Download original image
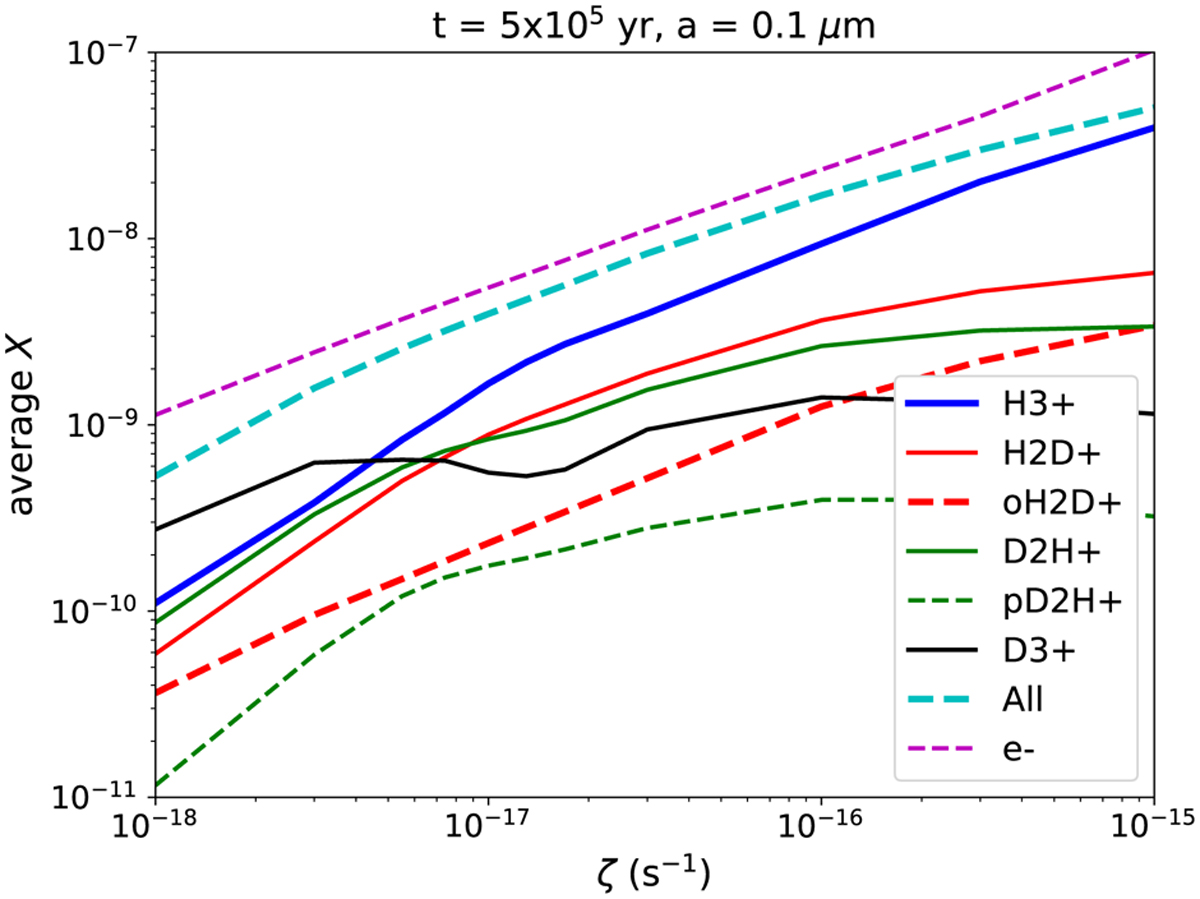
Average fractional abundances of ![]() , its deuterated isotopo-logues, and electrons in the core model as functions of the cosmic-ray ionisation rate,
, its deuterated isotopo-logues, and electrons in the core model as functions of the cosmic-ray ionisation rate, ![]() . The solid red curve shows the total (ortho + para) abundance of H2D+, whereas the dashed red curve shows the fractional oH2D+ abundance separately. Likewise, the dashed green curve shows the fractional pD2H+ abundance. The combined fractional abundance of all modifications of
. The solid red curve shows the total (ortho + para) abundance of H2D+, whereas the dashed red curve shows the fractional oH2D+ abundance separately. Likewise, the dashed green curve shows the fractional pD2H+ abundance. The combined fractional abundance of all modifications of ![]() , denoted
, denoted ![]() in the text, is shown with the dashed cyan curve.
in the text, is shown with the dashed cyan curve.
Current usage metrics show cumulative count of Article Views (full-text article views including HTML views, PDF and ePub downloads, according to the available data) and Abstracts Views on Vision4Press platform.
Data correspond to usage on the plateform after 2015. The current usage metrics is available 48-96 hours after online publication and is updated daily on week days.
Initial download of the metrics may take a while.