Fig. 7
Download original image
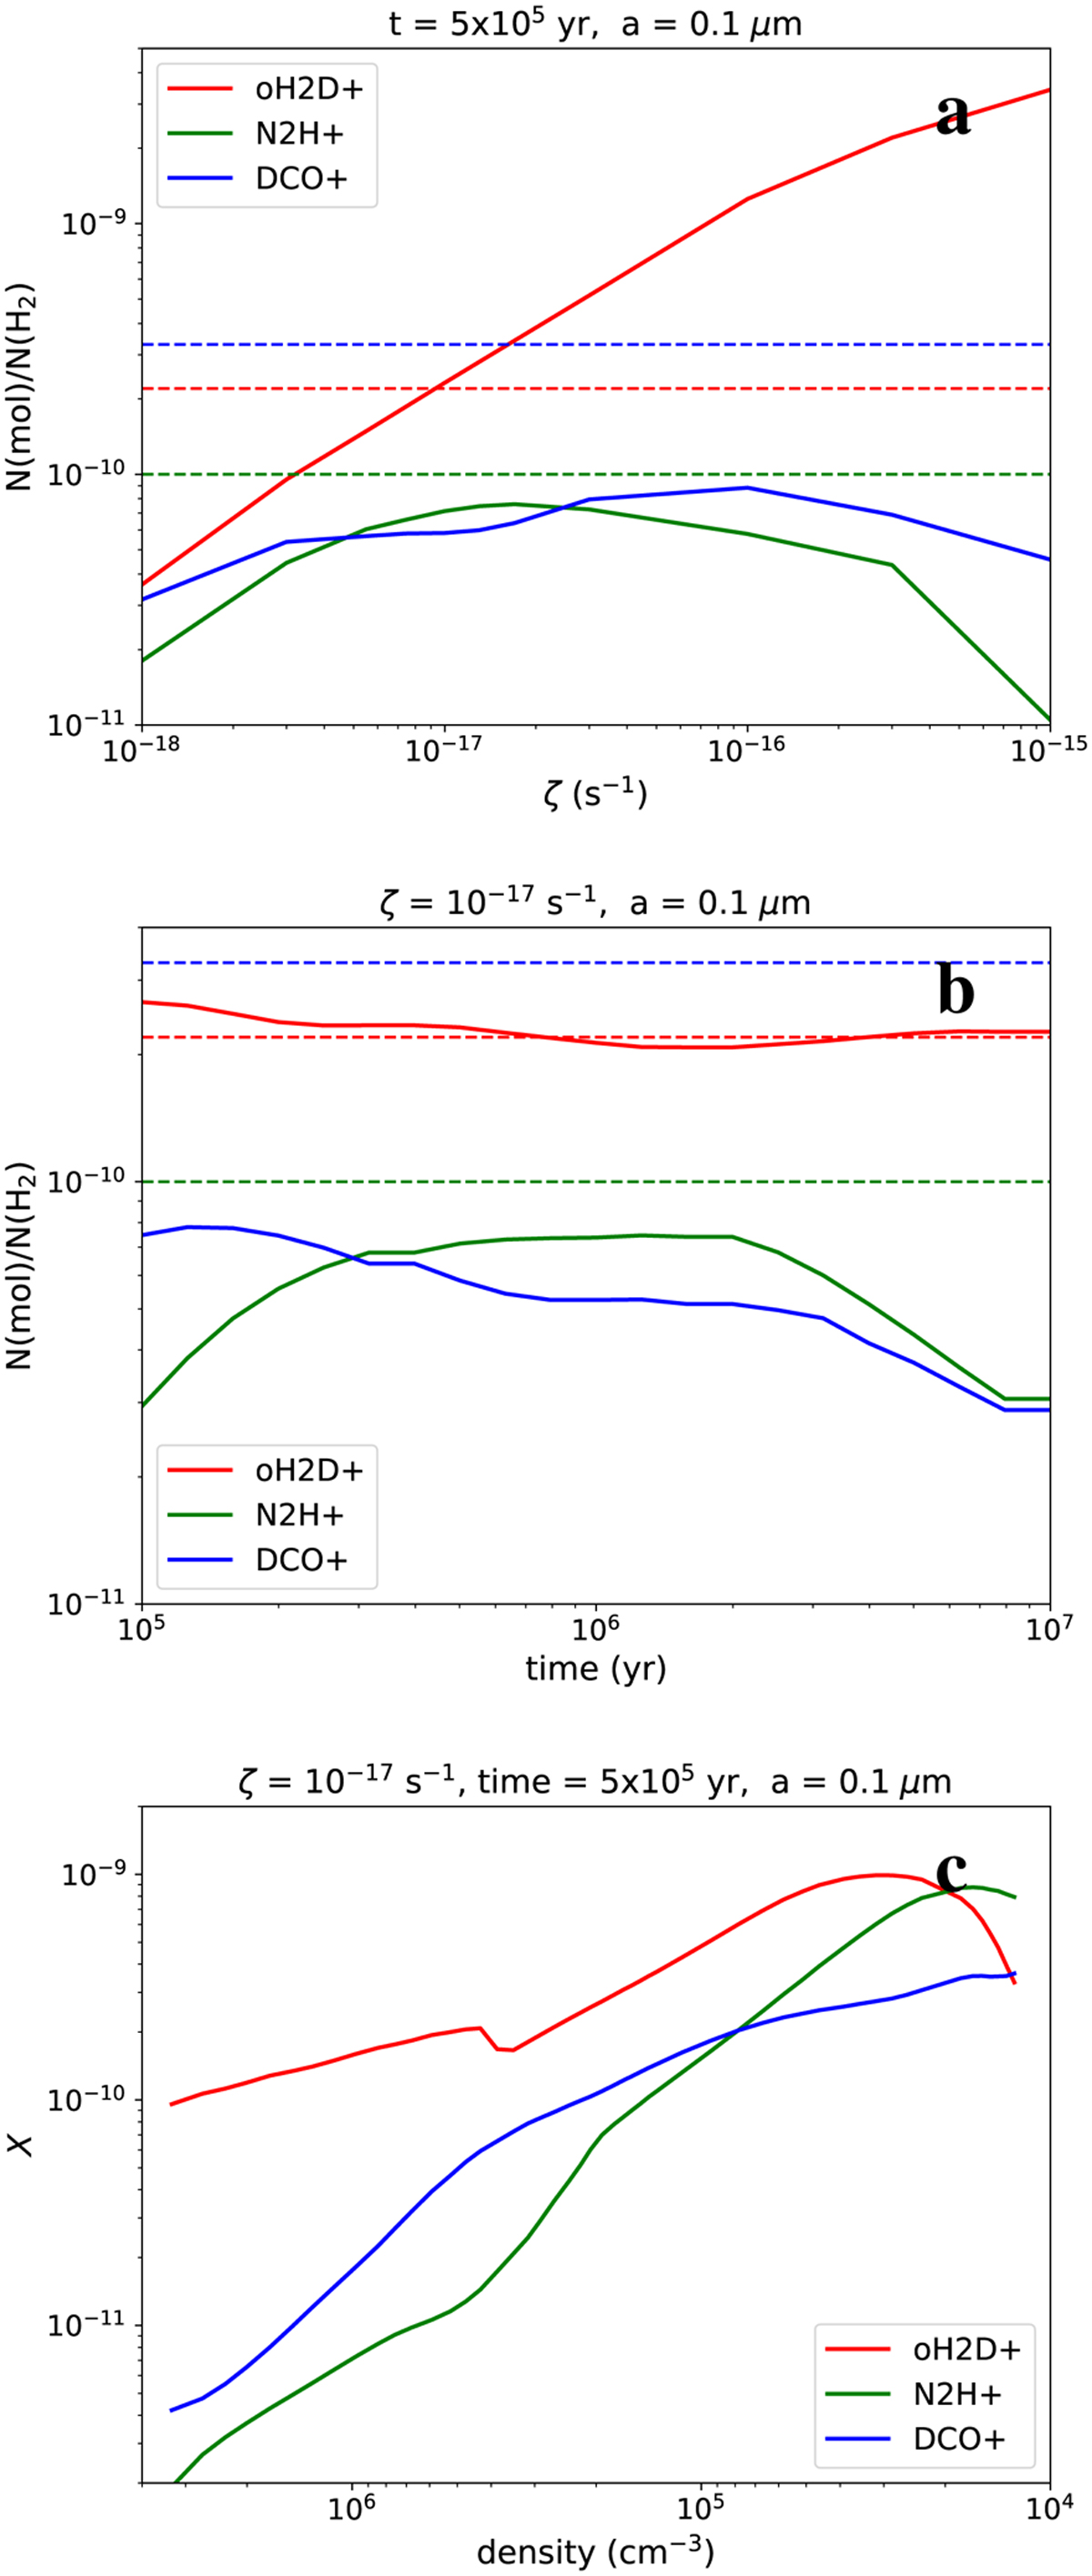
Predictions for the fractional oH2D+, N2H+, and DCO+ abundances as functions of the cosmic-ray ionisation rate, ![]() (a) time, (b), and gas density (c) according to our chemistry model. The first two (a and b) represent the column density ratios N(mol)/N(H2) through the centre of the core. In panels a and c, the simulation time is 5 × 10⁵ yr. In panels b and c,
(a) time, (b), and gas density (c) according to our chemistry model. The first two (a and b) represent the column density ratios N(mol)/N(H2) through the centre of the core. In panels a and c, the simulation time is 5 × 10⁵ yr. In panels b and c, ![]() . The dashed lines in panels a and b show the fractional abundances estimated via the LTE method in Sect. 3. In panel c, higher densities are on the left to be consistent with Fig. 6.
. The dashed lines in panels a and b show the fractional abundances estimated via the LTE method in Sect. 3. In panel c, higher densities are on the left to be consistent with Fig. 6.
Current usage metrics show cumulative count of Article Views (full-text article views including HTML views, PDF and ePub downloads, according to the available data) and Abstracts Views on Vision4Press platform.
Data correspond to usage on the plateform after 2015. The current usage metrics is available 48-96 hours after online publication and is updated daily on week days.
Initial download of the metrics may take a while.