Fig. F.1
Download original image
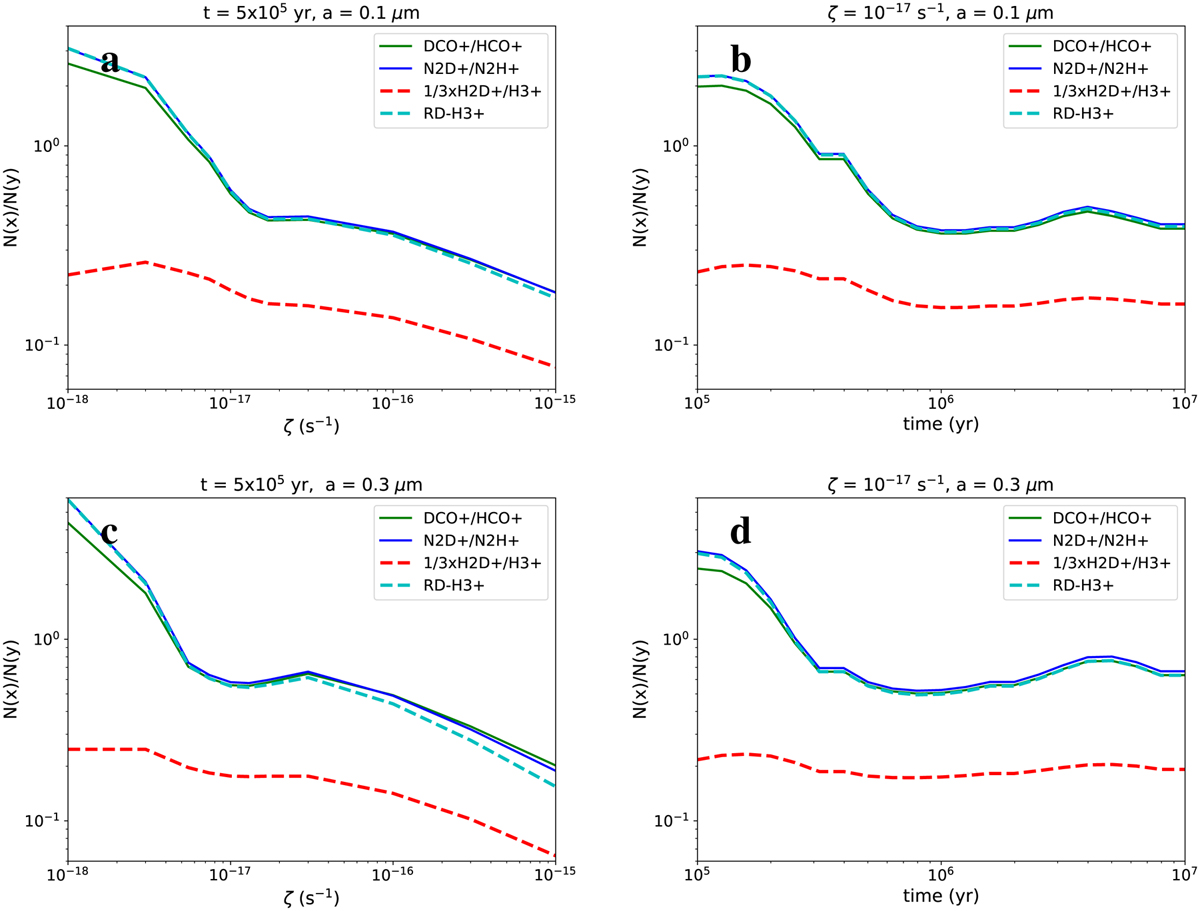
Fractionation ratios DCO+/HCO+ and N2D+/N2H+ as functions of ![]() (left) and time (right) according to our chemistry model. The upper row (a and b) corresponds to a model with the grain radius a = 0.1 µm, whereas the simulation used for the bottom row (c and d) assumes a = 0.3 µm. The cyan curve shows the prediction from a steady-state formula derived for a chemical network that includes multiply deuterated forms (see Sect. 7). The dashed red curve shows the ratio
(left) and time (right) according to our chemistry model. The upper row (a and b) corresponds to a model with the grain radius a = 0.1 µm, whereas the simulation used for the bottom row (c and d) assumes a = 0.3 µm. The cyan curve shows the prediction from a steady-state formula derived for a chemical network that includes multiply deuterated forms (see Sect. 7). The dashed red curve shows the ratio ![]() .
.
Current usage metrics show cumulative count of Article Views (full-text article views including HTML views, PDF and ePub downloads, according to the available data) and Abstracts Views on Vision4Press platform.
Data correspond to usage on the plateform after 2015. The current usage metrics is available 48-96 hours after online publication and is updated daily on week days.
Initial download of the metrics may take a while.