Fig. B.1
Download original image
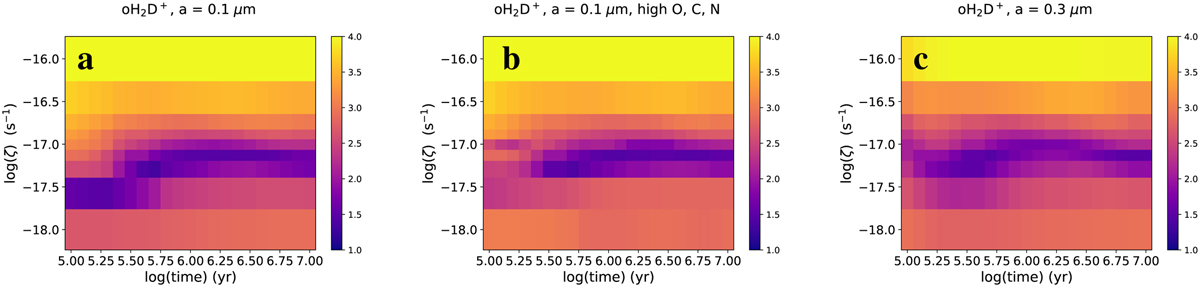
Chi-square maps from comparison between the observed and simulated oH2D+ integrated intensity maps described in Sect. 6. The y-axis in the plots is the logarithm of the cosmic-ray ionisation rate, ![]() , and the x-axis is logarithm of time. The χ2 values are also presented on a logarithmic scale: a darker shade means a better fit. The plot on the left (a) represents simulations with the grain radius a = 0.1 µm and low elemental abundances of O, C, and N, assumed in several previous models of H-MM1, and that in the middle (b) simulations with some 40%–60% higher elemental O, C, and N abundances. The chi-square map on the right (c), is from a simulation with the grain radius a = 0.3 µm and low O, C, and N abundances (see Sect. 5).
, and the x-axis is logarithm of time. The χ2 values are also presented on a logarithmic scale: a darker shade means a better fit. The plot on the left (a) represents simulations with the grain radius a = 0.1 µm and low elemental abundances of O, C, and N, assumed in several previous models of H-MM1, and that in the middle (b) simulations with some 40%–60% higher elemental O, C, and N abundances. The chi-square map on the right (c), is from a simulation with the grain radius a = 0.3 µm and low O, C, and N abundances (see Sect. 5).
Current usage metrics show cumulative count of Article Views (full-text article views including HTML views, PDF and ePub downloads, according to the available data) and Abstracts Views on Vision4Press platform.
Data correspond to usage on the plateform after 2015. The current usage metrics is available 48-96 hours after online publication and is updated daily on week days.
Initial download of the metrics may take a while.