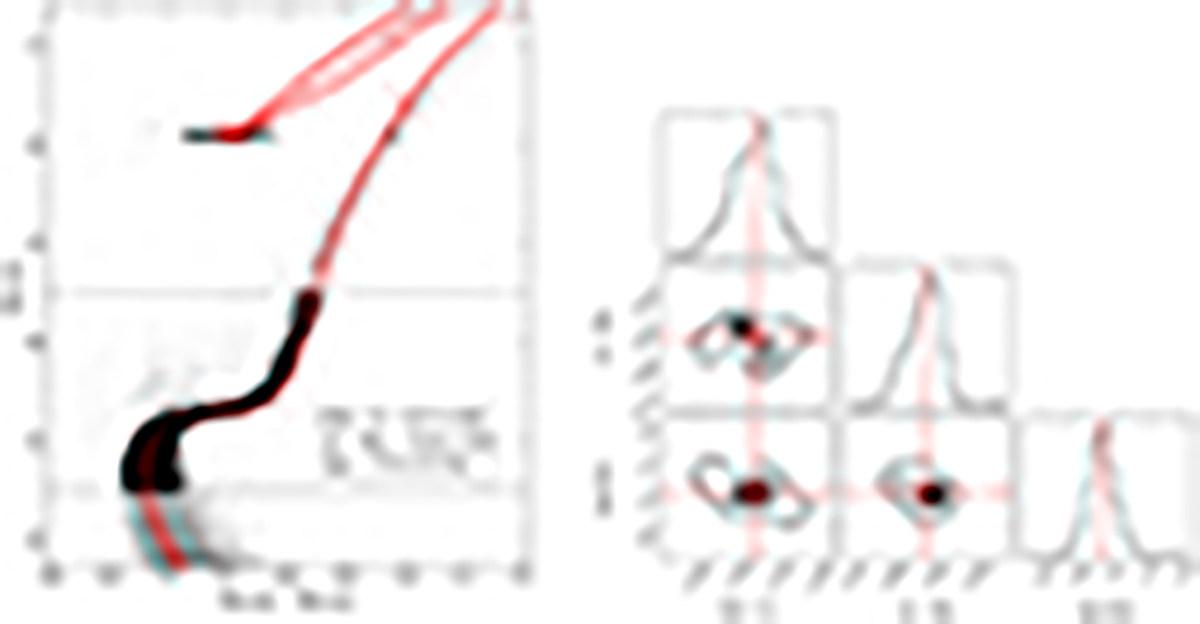
Fig. 8.
Download original image
Diagnostic plots for the determination of the distance, the reddening, and the age of M75. Left panel: CMD of M75 (gray dots) with the best-fit BaSTI isochrone computed with [Fe/H] = −1.3 dex plotted as a solid red line. The dashed red isochrones represent the uncertainties on the parameters. The black circles mark the stars used for the isochrone fitting procedure. The resulting best-fit values of color excess, distance modulus, and age are labeled. Right panel: corner plots showing the 1D and 2D projections of the posterior probability distributions for all the parameters derived from the MCMC method. The contours correspond to the 68%, 95%, and 99% confidence levels.
Current usage metrics show cumulative count of Article Views (full-text article views including HTML views, PDF and ePub downloads, according to the available data) and Abstracts Views on Vision4Press platform.
Data correspond to usage on the plateform after 2015. The current usage metrics is available 48-96 hours after online publication and is updated daily on week days.
Initial download of the metrics may take a while.