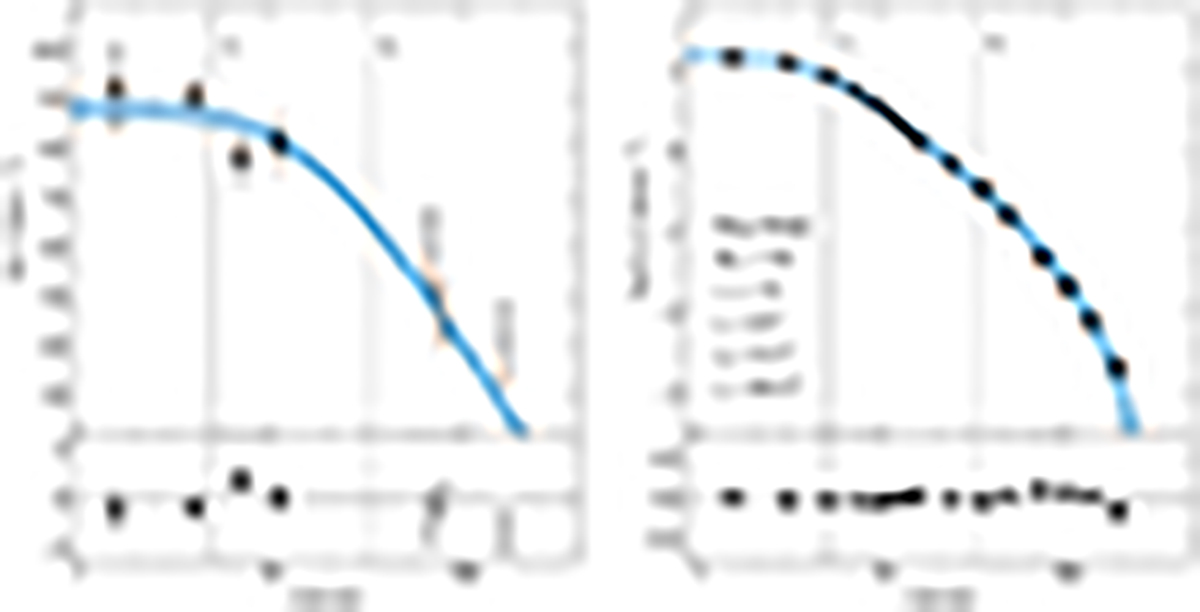
Fig. 7.
Download original image
Projected velocity dispersion and density profiles of M75. Left panel: projected velocity dispersion profile of M75 obtained from the MUSE RV measures discussed in this work (black circles). The values of the line-of-sight velocity dispersion quoted in the online repository (https://people.smp.uq.edu.au/HolgerBaumgardt/globular/) and the one obtained from Gaia proper motions (Vasiliev & Baumgardt 2021) rescaled to the distance estimated in Sect. 5 (see Table 3) are also plotted as empty circles and an empty square, respectively. The blue line corresponds to the best-fit King model derived from the simultaneous fit to this profile and the density profile shown in the right panel. The shaded regions show the 1σ uncertainty on the best fit. The dashed and dotted vertical lines mark the derived core radius (rc) and half-mass radius (rh), respectively. The bottom panel shows the residuals between the King model and the observations. Right panel: projected density profile from resolved star counts obtained by Contreras Ramos et al. (2012, black circles). The meaning of the lines, shaded region, and bottom panel is the same as in the left panel. The values of the best-fit central dimensionless potential (W0), concentration parameter (c), rc, rh, and tidal radius (rt) are labeled in the panel.
Current usage metrics show cumulative count of Article Views (full-text article views including HTML views, PDF and ePub downloads, according to the available data) and Abstracts Views on Vision4Press platform.
Data correspond to usage on the plateform after 2015. The current usage metrics is available 48-96 hours after online publication and is updated daily on week days.
Initial download of the metrics may take a while.