Fig. 6.
Download original image
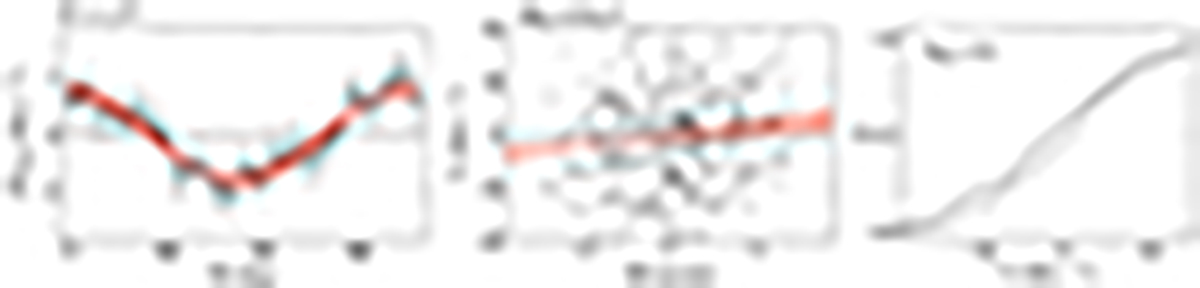
Diagnostic diagrams of the rotation signal detected in M75, within 7″ from the cluster center. Left panel: difference between the mean RV on each side of an axis passing through the center as a function of the PA of the axis itself. The red line is the sine function that best fits the observed pattern, while the red shaded region marks the confidence level at 3σ. Central panel: distribution of the RVs referred to Vsys (Vr), as a function of the projected distances from the rotation axis (XR) in arcseconds. The value of PA0 is labeled. The dashed red line is the least square fit to the data, and the red shaded area represents the 1σ uncertainty of the linear fit. Right panel: cumulative Vr distributions for the stars with XR < 0 (solid line) and for those with XR > 0 (dotted line). The KS probability that the two subsamples are extracted from the same parent distribution is labeled.
Current usage metrics show cumulative count of Article Views (full-text article views including HTML views, PDF and ePub downloads, according to the available data) and Abstracts Views on Vision4Press platform.
Data correspond to usage on the plateform after 2015. The current usage metrics is available 48-96 hours after online publication and is updated daily on week days.
Initial download of the metrics may take a while.