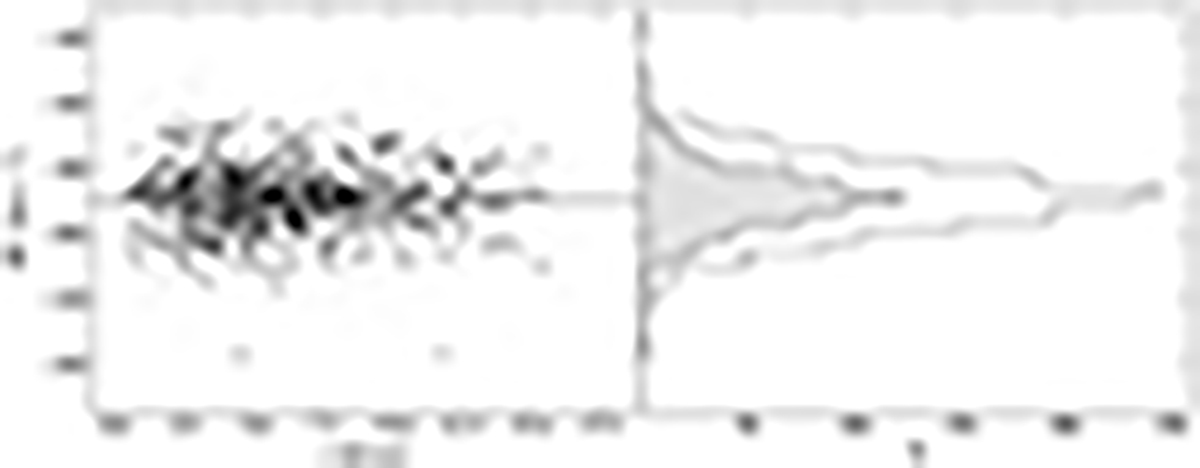
Fig. 5.
Download original image
Line-of-sight velocity distribution of M75. Left panel: RVs of the final MUSE catalog (see Sect. 3.3) plotted as a function of the distance from the cluster center. The black dots highlight the sample of the well-measured stars (i.e., those with S/N > 20 and RV error < 5 km s−1) that is used for the kinematic analysis. Right panel: empty histogram showing the number distribution of the entire RV sample, and gray histogram corresponding to the subsample of bona fide stars (black dots in the left panel).
Current usage metrics show cumulative count of Article Views (full-text article views including HTML views, PDF and ePub downloads, according to the available data) and Abstracts Views on Vision4Press platform.
Data correspond to usage on the plateform after 2015. The current usage metrics is available 48-96 hours after online publication and is updated daily on week days.
Initial download of the metrics may take a while.