| Issue |
A&A
Volume 688, August 2024
|
|
|---|---|---|
| Article Number | A135 | |
| Number of page(s) | 12 | |
| Section | Interstellar and circumstellar matter | |
| DOI | https://doi.org/10.1051/0004-6361/202449969 | |
| Published online | 09 August 2024 | |
The backreaction of stellar wobbling on accretion discs of massive protostars
1
Institute of Space Sciences (ICE, CSIC), Campus UAB,
Carrer de Can Magrans s/n,
08193
Barcelona,
Spain
e-mail: This email address is being protected from spambots. You need JavaScript enabled to view it.
2
Ural Federal University,
19 Mira Str.,
620002
Ekaterinburg,
Russia
3
Research Institute of Physics, Southern Federal University,
Rostov-on-Don
344090,
Russia
Received:
13
March
2024
Accepted:
29
May
2024
Abstract
Context. In recent years, it has been demonstrated that massive stars see their infant circumstellar medium shaped into a large irradiated, gravitationally unstable accretion disc during their early formation phase. Such discs constitute the gas reservoir from which nascent high-mass stars gain a substantial fraction of their mass by episodic accretion of dense gaseous circumstellar clumps, simultaneously undergoing accretion-driven bursts and producing close-orbit spectroscopic companions of the young high-mass stellar object.
Aims. We aim to evaluate the effects of stellar motion caused by the disc non-axisymmetric gravitational field on the disc evolution and its spatial morphology. In particular, we analyse the disc’s propensity to gravitational instability and fragmentation and the disc’s appearance in synthetic millimetre band images pertinent to the ALMA facility.
Methods. We employed three-dimensional radiationhydrodynamical simulations of the surroundings of a young massive star in the non-inertial spherical coordinate system, adopting the highest spatial resolution to date and including the indirect star-disc gravitational potential caused by the asymmetries in the circumstellar disc. The resulting disc configurations were post-processed with the radiation transfer tool RADMC-3D and CASA software to obtain synthetic images of the disc.
Results. We confirm that the early evolution of the accretion disc is notably different when stellar wobbling is taken into account. The redistribution of angular momentum in the system makes the disc smaller and rounder, reduces the number of circumstellar gaseous clumps formed via disc gravitational fragmentation, and prevents the ejection of gaseous clumps from the disc. The synthetic predictive images at millimetre wavelengths of the accretion disc that includes stellar wobbling are in better agreement with the observations of the surroundings of massive young stellar objects, namely AFGL 4176 mml, G17.64+0.16, and G353.273, than our simulations of numerical hydrodynamics that omit this physical mechanism.
Conclusions. Our work confirms that stellar wobbling is an essential ingredient to account for in numerical simulations of accretion discs of massive protostars.
Key words: circumstellar matter / stars: massive / stars: pre-main sequence / stars: protostars
© The Authors 2024
 Open Access article, published by EDP Sciences, under the terms of the Creative Commons Attribution License (https://creativecommons.org/licenses/by/4.0), which permits unrestricted use, distribution, and reproduction in any medium, provided the original work is properly cited.
This article is published in open access under the Subscribe to Open model. This email address is being protected from spambots. You need JavaScript enabled to view it. to support open access publication.
1 Introduction
Although the formation of massive stars is a rare event, those objects are preponderant engines in the life cycle of matter in galaxies. The mystery of their birth principally lies in the high optical depth of the parent pre-stellar cores in which they form. Apart from revealing their common multiplicity (Kraus et al. 2017), the quest for the first observation of Keplerian-orbiting material around massive young stellar objects (MYSOs) initially saw a breakthrough through the works of Johnston et al. (2015); Ilee et al. (2016); Forgan et al. (2016); Ginsburg et al. (2018); Maud et al. (2018). The study of MYSOs continued with the hunt for evidence of filamentary or clumpy substructures in discs around W33A MM1-Main (Maud et al. 2017) G350.69–0.49 (Chen et al. 2017), and G11.92–0.61 MM1 (Ilee et al. 2018). Apart from this, accretion variability onto high-mass protostars has been monitored in MYSOs (Keto & Wood 2006; Stecklum et al. 2017) and in pulsed bipolar outflows (Cunningham et al. 2009; Cesaroni et al. 2010; Caratti o Garatti et al. 2015; Purser et al. 2016, 2018; Reiter et al. 2017; Burns et al. 2017; Burns 2018; Samal et al. 2018).
Since the variability of the accretion flow onto the surface of massive protostars governs their pre-main-sequence evolution in the Hertzsprung-Russell diagram (Meyer et al. 2019a), the study of MYSOs is therefore tied to the understanding of the inhomogeneities and substructures in their circumstellar discs as likely causes of the accretion variability. These non-axisymmetric disc features are possibly produced by the instabilities of a self-gravitating nature and have been extensively studied in the context of low-mass stellar objects (Papaloizou & Savonije 1991; Pickett et al. 2003; Rafikov 2005, 2007). Several questions remain wide open, such as the chemical evolution of MYSOs (Ahmadi et al. 2018; Guadarrama et al. 2024) and the role of magnetic fields in the regulation of their fragmentation (Hennebelle et al. 2016).
The circumstellar medium of massive protostars has been investigated using computationally intensive numerical simulations (see, e.g., Krumholz et al. 2007a,b, 2009a; Harries 2015; Harries et al. 2017). These calculations raised a number of questions and revealed technical challenges caused by the three-dimensional intrinsic nature of the problem and by the multiple physical processes involved in the formation mechanism of massive stars (cooling and heating of the gas, protostellar irradiation, and radiation transport into the disc, disc wind, non-ideal magneto-hydrodynamical processes, etc.). Amongst the many approaches developed to tackle the problem of massive star formation, the new paradigm known as the burst mode of accretion produced results not only consistent with models and observations of the lower-mass regimes of star formation but also with direct observations of forming massive stars.
The burst mode of accretion is a depiction of star-forming processes that fills the gap between the episodic accretion onto protostars and the luminous bursts originating from young stellar objects, and it has been observed in some star-forming regions (Vorobyov & Basu 2005, 2006, 2010, 2015; Machida et al. 2011). In this picture, clumpy circumstellar material from gravitationally unstable accretion discs around young stars resulting from the infall of the molecular material of prestellar cores migrates inward from the disc to the protostellar surface, triggering a sudden luminosity rise. This provides an explanation to the so-called FU-Orionis accretion-driven burst phenomenon and offers evident connections to the prezero-age-main-sequence stellar evolution (Elbakyan et al. 2019) and the prediction as well as observations of substructures in discs (Dong et al. 2016). The general idea of the burst mode of accretion was extended and elaborated by Nayakshin and co-authors to better explain the burst phenomenon and include planet formation in inward-migrating clumps (Nayakshin 2010, 2016, 2017; Nayakshin & Lodato 2012; Vorobyov & Elbakyan 2018; Elbakyan et al. 2021, 2023).
Interestingly, this picture originally developed for the low-mass regime of star formation can be naturally extended to the primordial and massive regimes of star formation. In Meyer et al. (2017, 2018), it was shown that a self-consistent picture unifying disc fragmentation and binary formation in the context of MYSOs is possible, linking both accretion-driven outbursts, as monitored in the MYSOs S255IR-NIRS3 and NGC 6334I-MM1, to the close and/or spectroscopic companions of some massive stars (Mahy et al. 2013; Kobulnicky et al. 2014; Chini et al. 2012). In particular, accretion-driven outbursts are interpreted as being the observational signature of the presence of a self-gravitating disc shaped by efficient gravitational instability. The bursts occur in a series of multiple eruptions, and their intensity is a function of the mass of the accreted material (Meyer et al. 2019c). Such episodic flares provide evidence of the sudden increment of the protostellar mass with dense, compact circumstellar material (Elbakyan et al. 2023) that affect the internal structure of the protostars, profoundly changing their surface properties and provoking excursions in the Hertzsprung-Russel diagram (Meyer et al. 2019a).
Numerical results have preceded the direct observation of an accretion disc around a young high-mass star. Such predictions can be divided into two distinct categories of models, as the results are obtained either using a Cartesian grid with an adaptive mesh refinement method and a protostar that is allowed to move freely inside the computational domain (Krumholz et al. 2007a, 2009b; Peters et al. 2010; Commerçon et al. 2011b; Seifried et al. 2011, 2012, 2013, 2015; Klassen et al. 2014, 2016; Rosen et al. 2016; Mignon-Risse et al. 2021, 2023a; Commerçon et al. 2022), or using a spherical grid with a static logarithmic mesh and assuming that the growing protostar is fixed to the origin of the domain (Kuiper et al. 2010a,b, 2011; Kuiper & Yorke 2013a,b; Meyer et al. 2017, 2018, c,b; Ahmadi et al. 2019; Oliva & Kuiper 2020, 2023a,b; Meyer et al. 2021). In both cases, the initial conditions and the included microphysical processes in the models are similar (e.g. self-gravity, radiation transport coupled to protostellar evolution).
Cartesian grids have the advantage of not needing coordinate singularities, and they permit a straightforward implementation of the stellar motion. However, the inclusion of stellar radiation transfer into the models makes calculations computationally expensive. Spherical grids allow a high spatial resolution to be reached in the inner circumstellar environment of protostars, which has permitted the burst mode of accretion in the context of massive star formation to be revealed (Meyer et al. 2017). Both computing philosophies have been thoroughly compared on the basis of high spatial resolution simulations in Mignon-Risse et al. (2023b), and the authors concluded that the two approaches are in qualitative agreement, with the remaining differences in their results being minor.
Nevertheless, we showed in Meyer et al. (2022) that when permitting the protostar to move, as a consequence of the disc-star gravitational interaction, stellar motion delays disc fragmentation and affects the millimetre continuum emission properties (Meyer et al. 2022). Such an effect is not included in the comparison study of Mignon-Risse et al. (2023b). The difference between the spherical models of Meyer et al. (2022) and the Cartesian simulations of Mignon-Risse et al. (2023b) lie in the spatial resolution and the absence or presence of stellar wobbling, and this omission was the motivation of our study, whose goal is to perform a comparison of disc simulations with and without the inclusion of stellar inertia and with the resolution of Mignon-Risse et al. (2023b).
This study aims at investigating the effects of finite stellar inertia on the formation and growth of circumstellar accretion discs around massive protostars. We also address the question of the millimetre observability by continuum dust emission of such disc nebulae and of the substructures forming in them by gravitational instability. To this end, a pair of three-dimensional gravito-radiation-hydrodynamics numerical simulations were performed and were resolved with the highest-to-date spatial resolution used in a spherically based calculation in the study of Mignon-Risse et al. (2023b). We considered two scenarios: without and with stellar inertia, that is, without and with the star motion in response to the gravitational interaction with the disc. Select characteristic outcomes of the simulations were post-processed with radiation transfer and imaging methods in order to produce synthetic 1.3 mm dust continuum images for the Atacama Large Millimeter/submillimeter Array (ALMA) interferometer operating in its band 6 (see the work of Meyer et al. 2018; Jankovic et al. 2019). With these images, we explored the indirect effects of stellar inertia on the disc structure, its eventual fragmentation by efficient gravitational instability, and the formation of gaseous clumps therein and their dynamics inside (migration) and outside (ejection) the disc. Finally, we compared the most realistic high-resolution disc model, possessing both a high spatial resolution and with stellar inertia included in it, to observations available in the literature.
This work is organised as follows. In Sec. 2, the methods used to perform high-resolution hydrodynamical simulations of a realistic accretion disc around a young massive star are presented together with the radiation transfer procedure utilised to predict its continuum thermal dust emission at the millilitre waveband. In Sect. 3, we introduce the reader to the results and details of the hydrodynamical simulations of accretion discs surrounding massive protostars. The radiative transfer calculations for the dust continuum emission of the stellar surroundings of these forming massive stars are shown in Sec. 4 for several characteristic time instances of the disc evolution. Finally, conclusions are provided in Sect. 5.
Simulation models performed in our study.
2 Method
In this section, the methods are presented. We show that used to simulate and predict the millimetre continuum appearance as seen by the ALMA interferometer of the circumstellar medium of a forming massive protostar are presented.
2.1 Radiation-hydrodynamics simulations
Numerical simulations of accretion discs around protostars were carried out under the assumption of a midplane-symmetric computational domain. It was initialised with a Mc = 100 M⊙ pre-stellar core of uniform temperature Tc = 10 K that is rigidly rotating. The initial mass density distribution is spherically symmetric and profiled as
![Mathematical equation: $\[\rho(r)=\frac{3}{8 \pi} \frac{M_{\mathrm{c}}}{R_{\mathrm{c}}^{3 / 2}} r^{-3 / 2},\]$](/articles/aa/full_html/2024/08/aa49969-24/aa49969-24-eq1.png) (1)
(1)
where r is the radial coordinate and Rc is the outer core radius. The gas angular velocity of the pre-stellar core was initialised according to the distribution Ω(R) ∝ R−3/2, with the cylindrical radius R = r sin(θ) and according to the rotational-to-gravitational energy ratio
![Mathematical equation: $\[\beta=\frac{E_{\mathrm{rot}}}{E_{\mathrm{grav}}}=0.04 \propto \frac{1}{7} \frac{1}{G M_{\mathrm{c}} R_{\mathrm{c}}^{-3}} \int_0^\pi \mathrm{d} \theta \sin (\theta)^3.\]$](/articles/aa/full_html/2024/08/aa49969-24/aa49969-24-eq2.png) (2)
(2)
The grid mesh [rin, Rc] × [0, π/2] × [0, 2π] mapping the computational domain expands logarithmically along the radial direction r as a cosine in the polar direction θ and is uniform along the azimuthal direction ϕ. It is made of Nr = 512 × Nθ = 81 5 Nϕ = 512 grid zones, respectively. The inner radius rin constitutes a semi-permeable sink cell fixed onto the origin of the domain, and the outer radius, assigned to outflow boundary conditions, is located at Rc = 0.1 pc. In this study, we adopted rin = 20 au, which permits the highly resolved models to reach long integration times tend without dealing with dramatic time step restrictions in the innermost grid zones. The utilised grid spatially resolves the inner region of the midplane, where the disc fragments are accreted, while keeping the overall number of grid cells to a decent value and thus reducing the numerical cost of this computationally intensive calculation.
The numerical simulations followed the gravitational collapse of the pre-stellar core and the early evolution of the circumstellar disc around the massive protostar, accounting for both the stellar direct irradiation of protostellar photospheric photons and the radiation transport into the circumstellar medium. The accretion rate onto the protostar was calculated as the material loss ![Mathematical equation: $\[\dot{M}\]$](/articles/aa/full_html/2024/08/aa49969-24/aa49969-24-eq3.png) through the sink cell, and the surface and intrinsic properties of the protostar (e.g. the stellar radius and the photospheric luminosity) were time-dependently interpolated using the pre-calculated protostellar evolutionary tracks of Hosokawa & Omukai (2009) (see also Meyer et al. 2017, 2018). Two models were performed with the above-described initial conditions, namely, with and without the inclusion of stellar inertia (Table 1).
through the sink cell, and the surface and intrinsic properties of the protostar (e.g. the stellar radius and the photospheric luminosity) were time-dependently interpolated using the pre-calculated protostellar evolutionary tracks of Hosokawa & Omukai (2009) (see also Meyer et al. 2017, 2018). Two models were performed with the above-described initial conditions, namely, with and without the inclusion of stellar inertia (Table 1).
2.2 Governing equations
The set of equations describing the dynamics of the pre-stellar core collapse reads as
![Mathematical equation: $\[\frac{\partial \rho}{\partial t}+\boldsymbol{\nabla} \cdot(\rho v)=0,\]$](/articles/aa/full_html/2024/08/aa49969-24/aa49969-24-eq4.png) (3)
(3)
![Mathematical equation: $\[\frac{\partial \rho v}{\partial t}+\boldsymbol{\nabla} \cdot(\rho v \otimes v)+\boldsymbol{\nabla} p=f,\]$](/articles/aa/full_html/2024/08/aa49969-24/aa49969-24-eq5.png) (4)
(4)
![Mathematical equation: $\[\frac{\partial E}{\partial t}+\boldsymbol{\nabla} \cdot((E+p) v)=v \cdot f,\]$](/articles/aa/full_html/2024/08/aa49969-24/aa49969-24-eq6.png) (5)
(5)
which are the relations for the conservation of the mass, the momentum, and the energy of the infalling material. In the above relations, the gas density is ρ, the thermal pressure p = (γ − 1)Eint, the gas velocity υ, and γ = 5/3 is the adiabatic index. Hence,
![Mathematical equation: $\[E=E_{\mathrm{int}}+\rho \frac{v^2}{2}=\frac{p}{(\gamma-1)}+\rho \frac{v^2}{2}\]$](/articles/aa/full_html/2024/08/aa49969-24/aa49969-24-eq7.png) (6)
(6)
is the total energy of the gas. The right-hand term of the momentum and energy conservation laws are the force density vector,
![Mathematical equation: $\[f=-\rho \boldsymbol{\nabla} \Phi_{\mathrm{tot}}-\lambda \boldsymbol{\nabla} E_{\mathrm{R}}-\boldsymbol{\nabla} \cdot\left(\frac{F_{\star}}{c}\right) e_{\mathrm{r}},\]$](/articles/aa/full_html/2024/08/aa49969-24/aa49969-24-eq8.png) (7)
(7)
with the flux limiter λ = 1/3, the thermal radiation energy density ER, the radial unit vector er, the protostellar radiation flux F*, and the speed of light c. The quantity Φtot is the total gravitational potential of the gas and the star, including the indirect potential as described below.
2.3 Stellar inertia
This numerical setup uses the implementation for stellar motion presented in Regály & Vorobyov (2017); Hirano et al. (2017); Meyer et al. (2022). It is implemented as an additional indirect potential, Φwobbling, together with its associated force Fwobbling. This indirect force is implemented as the following acceleration:
![Mathematical equation: $\[\boldsymbol{g}^{\prime}+\frac{\boldsymbol{F}_{\mathrm{disc} / \star}}{M_{\star}}=0,\]$](/articles/aa/full_html/2024/08/aa49969-24/aa49969-24-eq9.png) (8)
(8)
where the disc-to-protostar gravitational force reads
![Mathematical equation: $\[\boldsymbol{F}_{\mathrm{disc} / \star}=-G M_{\star} \int_{\operatorname{disc}} \frac{\rho(r) \mathrm{d} V}{r^2} \boldsymbol{e}_{\mathrm{r}},\]$](/articles/aa/full_html/2024/08/aa49969-24/aa49969-24-eq10.png) (9)
(9)
with the protostellar mass M*, the gravitational constant G, the radial unit vector er, and the mass in a volume element dMdisc(r) = ρ(r)dV. Hence, the total gravitational potential reads as Φtot = Φsg + Φwobbling, where Φsg is the input from the disc, the envelope, and the star. The purpose of this study consists of exploring the effects of the stellar inertia on the dynamics and morphology of accretion discs at a spatial resolution exceeding that of the previous study of this series (see Meyer et al. 2022).
2.4 Numerical methods
The equations of gravito-radiation-hydrodynamics were solved with the PLUTO code1 (Mignone et al. 2007, 2012).. The direct irradiation feedback of the protostar and the radiation transport in the accretion disc were both taken into account within the gray approximation. It uses the numerical scheme presented in Kolb et al. (2013)2 and adapted in Meyer et al. (2018) for the study of massive star formation. It is an algorithm that first ray traces photon packages from the protostellar surface to the disc and then diffuses their propagation into it in the flux-limited approximation. This approach allowed us to accurately consider both the inner heating and the outer cooling of our irradiated accretion discs (see Vaidya et al. 2011). We note that similar radiation-hydrodynamics methods are also presented in Commerçon et al. (2011a), Flock et al. (2013), and Bitsch et al. (2014).
The opacity description as well as the estimate of the local dust properties are similar to those in Meyer et al. (2018), where the gas Tgas and dust Tdust temperatures were calculated assuming equilibrium between the silicate grains temperature and the total radiation field. Stellar gravity was modelled by calculating the total gravitational potential of the central protostar and includes the self-gravity of the gas by solving the Poisson equation using the PETSC library3. We neglected turbulent viscosity by assuming that the most efficient mechanism for the transport of angular momentum is the gravitational torques in a self-gravitating disc. The effects of the stellar inertia on the disc wobbling are included as described in Meyer et al. (2019c). The reader interested in further reading about the method can refer to the other papers in this series initiated with Meyer et al. (2017).
2.5 Construction of synthetic disc images
As a diagnostic to evaluate the effects of stellar inertia on realistic, high-resolution models of the circumstellar medium of massive protostars, synthetic ALMA images of the accretion discs were calculated using the post-processing method presented in Meyer et al. (2019b). For each panel displayed in Figs. 1–2, the dust density fields of the embedded accretion discs simulated with the PLUTO code were imported into the radiative transfer code RADMC-3D4 (Dullemond 2012). The standard dust-to-gas mass ratio of 0.01 was assumed when converting the gas density into that of dust. Then, the dust temperature was derived by Monte-Carlo calculation on the basis of the dust density, using the method presented in Bjorkman & Wood (2001) and using 1010 photons packages ray traced from the protostellar surface to the outer region of the accretion disc. The proper radiative transfer calculation against dust opacity of the star light scattered into the dusty disc was subsequently performed for a monochromatic light of wavelength centred on 1.2 mm (249.827 GHz with a channel width of 50.0 MHz) while considering that the dust is a Laor & Draine (1993) mixture of silicate particles. The photopshere was modelled as a black body of effective temperature Teff that is derived for each selected simulation snapshots as a function of the age of the protostar, that is, its mass and current accretion rate, which are used to bilinearly interpolate the protostellar evolutionary tracks of Hosokawa et al. (2010).
Finally, synthetic images of the accretion discs were generated with the Common Astronomy Software Applications CASA5 (McMullin et al. 2007) using the radiation flux output from RADMC-3D. No inclination angle for the accretion disc with respect to the plane of the sky was assumed throughout the whole simulation process, and images were produced with a field of view of 2000 au around the growing protostar. The simulated ALMA interferometric images were thus obtained. They can either serve as a test for the observability of the simulated accretion discs or as a tool to directly compare the disc models with available and/or forthcoming observations to be performed by the ALMA facility.
As in Meyer et al. (2019b), it was assumed that the conditions for the synthetic observations are ideal. In other words, the pattern of telescopes and antennae were considered to be in their most extended spatial configuration at the Llano de Chajnantor plateau, permitting the acquisition of long-baseline images resolved with the maximum possible spatial resolution with the smallest beam size. This resolution is about 0.015″ for the C43-10 configuration that makes use of 43 12 m antennae. The modelling of these Cycle 10 synthetic ALMA observations assumes an exposure time of 10 min and a precipitable water vapour pwv = 0.6. The assumed distance to the source was taken to be 1 kpc, which corresponds to that of the Earth’s closest high-mass star-forming region, Orion.
3 Results
This section presents the performed high-resolution disc models. We detail the simulations for our accretion disc and their morphological properties.
3.1 Disc evolution: 19.15–23.25 kyr after onset of the collapse
In our simulations: Run–512–100 M⊙−4%−wio (without stellar wobbling, left-hand panels) and Run−512−100 M⊙−4%−wi (with stellar wobbling, right-hand panels). The disc models are plotted at several characteristic time instances, namely 19.15 kyr (top series of panels), 19.85 kyr (middle series of panels), and 23.25 kyr (bottom series of panels), after onset of the gravitational collapse of the molecular cloud. The panels depict the inner (≤ 1600 au) region of the computational domain. The simulation began with the gravitational collapse of the rotating pre-stellar molecular cloud, and an accretion disc formed when the infalling flow hit the centrifugal barrier near the inner computational boundary engendered by the conservation of angular momentum of the infalling matter.
At 19.15 kyr, the accretion discs in both models had a round morphology and radii of about a few 100 au. At that time, the accretion disc is already structured with several spiral arms wrapped around the inner region of the disc. At this early time, differences between the models are noticeable in the sense that the disc modelled without stellar inertia is larger by almost a factor of two, and the spiral arms are more pronounced, extending to larger radii (Fig. 1a), while the disc in the model with stellar inertia is still smaller (Fig. 1b). Also at this time, a gaseous clump has formed by efficient gravitational instability in the disc without stellar inertia, which is the sign of faster gravitational fragmentation of the disc when the central protostar is not allowed to move (Fig. 1a).
At 19.85 kyr, one can see that the disc modelled without stellar inertia continues to grow in size up to a radius of ~450 au. Its internal structure includes spiral arms of different sizes and thicknesses separated by a more diluted interarmed space. The innermost arm is thinner and denser, and it hosts a circumstellar gaseous clump that migrates downward to the inner disc region, where the protostar is located and accretes mass. This mechanism is responsible for the production of accretion-driven outbursts (Meyer et al. 2017) and/or the formation of close binary companions to the young high-mass star (Meyer et al. 2018). Another clump also formed by gravitational instability in the accretion disc is ejected away from its parent accretion disc by the gravitational swing three-body mechanism (Fig. 1c). This is a major difference between the simulations without stellar inertia and those in which stellar inertia is included. Indeed, the disc modelled with stellar wobbling continues to display its round, slightly structured morphology, but it does not exhibit any sign of fragmentation up to this time instance (Fig. 1d). This confirms, on the basis of models with higher spatial resolution, the delay of disc fragmentation induced by stellar inertia compared to simulations neglecting the stellar motion in response to the disc-star gravitational interaction (Meyer et al. 2022).
At 23.25 kyr, the model Run–512–100 M⊙−4%−wio, which does not include stellar inertia, displays an accretion disc that has violently fragmented, and it exhibits all associated features, such as several spiral arms, many gaseous circumstellar clumps (Meyer et al. 2018), and a trail left behind the ejected clump (see Fig. 1c). We note that this clump has travelled away from the disc at a distance ≥1600 au (Fig. 1e). The clump ejection mechanism was described for the first time in the context of a low-mass star formation, when gravitationally fragmenting accretion discs of solar-type stars generate free-floating clumps that are thrown through the interstellar medium (see the studies of Basu & Vorobyov 2012; Vorobyov 2016). This time instance also reveals the first clear sign of efficient gravitational instability in the accretion disc model simulated with stellar inertia. A characteristic disc morphology develops, made of several spiral arms of similar extent and reaching ≥800 au, along with the establishment of a dense disc region where both spiral arms originate and gaseous clumps migrate (Fig. 1f). The two numerical models differ only slightly by the disc radius at this time instance, but they differ significantly in the number of gaseous clumps in them, which is notably higher in the case ignoring stellar inertia. This strengthens the conclusions of Meyer et al. (2022) regarding the slow-down and protracting effects of disc wobbling in the development of gravitational instability in accretion discs around massive protostars (Fig. 1e).
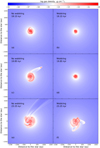 |
Fig. 1 Midplane density fields (in g cm−3) in the accretion disc hydrodynamical simulations performed without (left panels) and with (right panels) stellar inertia. The figures are shown for several time instances, namely, 19.15 (a, b), 19.85 (c, d), and 23.25 kyr (e, f). The initial kinetic-to-gravitational energy ratio of the collapsing molecular cloud is β = 4%. |
3.2 Disc evolution: 24.35–32.65 kyr after onset of the collapse
Figure 2 presents the disc evolution at later times. In particular, the gas spatial distributions are plotted at times 24.35 kyr (top series of panels), 27.55 kyr (middle series of panels), and 32.65 kyr (bottom series of panels) after onset of the gravitational collapse of the molecular cloud. The disc without stellar wobbling continues fragmenting and becomes larger as it accretes mass, extending its denser spiral arms and forming several disc-like structures around the clumps that are located at large orbits (~800 au; see Fig. 2a). The most important differences between the two models are the disc radial extend and the level of fragmentation of the disc. In particular, the disc with stellar inertia included is more compact and has smaller clumps that are not yet surrounded by their own accretion discs (see Fig. 2b). As underscored in Meyer et al. (2022) and in Regály & Vorobyov (2017), in the context of low-mass stars, the inclusion of stellar inertia in the simulations permits the transfer of part of the disc’s angular momentum to the wobbling star. Consequently, the disc angular momentum is smaller compared to the case without stellar inertia. Since disc fragmentation takes place at larger radii, discs that are more compact are expected to fragment less (Johnson & Gammie 2003).
Later, at times 24.35–27.55 kyr, the differences between the accretion discs modelled with and without the stellar inertia become more pronounced. The disc with a motionless protostar continues expanding up to a radius of ~1500 au, and most of the gaseous clumps themselves are surrounded by dense disclike structures (Fig. 2c). The structures around those clumps in turn experience accretion and acquire mass from the disc material, while their cores become denser and hotter, potentially up to the temperature of molecular hydrogen dissociation (see Meyer et al. 2018, 2022). For the disc modelled with stellar inertia, having a smaller size weakens the development of gravitational fragmentation, and in this case, a sole migrating clump on its way to being accreted by the protostar is visible in the inner disc region (Fig. 2d).
Finally, at 32.65 kyr, the disc with the fixed central young high-mass star has the most extended and complex morphology, composed of a pattern of spiral arms of different densities and lengths interspersed with gaseous clumps, themselves potentially surrounded by nascent accretion discs (Fig. 2e). This picture is a scaled-up version of the development of massive protoplanetary discs around young solar-type stars (see Vorobyov & Basu 2010 and, in the context of primordial star formation, Vorobyov et al. (2013)). At this time instance, the accretion disc model with stellar inertia included exhibits clear signs of fragmentation, with a large-scale spiral arm enrolled around the disc structure, and several dense clumps migrate towards the inner circumstellar region (Fig. 2f). The disc size is similar to that of the disc with a fixed protostar when it started fragmenting violently (Fig. 2a). We highlight the still ongoing displacement of the massive protostar away from its initial location at the beginning of the gravitational collapse, when it coincided with the geometrical centre of the pre-stellar core, at the origin of the computational domain.
4 Observational manifestations of stellar wobbling
This section presents predictions for the appearance of the accretion discs of young massive stars that we simulated, as seen by the ALMA interferometer. We compare the synthetic images and draw conclusions regarding the necessary and relevant physics to be included in models when simulating discs around massive protostars.
4.1 Synthetic ALMA images of the accretion discs
Figure 3 shows the synthetic millimetre images of the accretion discs as seen by the ALMA facility. The plots distinguish between models without (left-hand side panels) and with (right-hand side panels), and the disc models are displayed at several characteristic time instances, namely, 19.15 kyr (top series of panels), 19.85 kyr (middle series of panels), and 23.25 kyr (bottom series of panels) after the onset of the gravitational collapse of the molecular cloud. The panels display the inner (≤ 1600 au) region of the computational domain, which at a distance of 1 kpc, corresponds to a region in the plane of the sky that is 1.0 arcsec wide in both longitude and latitude. Both of the disc synthetic images at time 19.15 kyr have the appearance of a bright spot, which represents the nascent accretion disc that has just formed right after the end of the free-fall gravitational collapse (Figs. 3a, b). Except for two tiny protuberances, giving the image of the disc modelled with stellar inertia a slightly eared-like structure (Fig. 3a), no other features distinguish the two models from each other (Fig. 3b). We note that the images that we produced do not assume any inclination of the disc regarding the plane of the sky. Differences arise at time 19.85 kyr, when the disc without stellar inertia initiates fragmentation and develops a large spiral arm, which is enrolled all around the star and has a clump in it. Both substructures are observable by ALMA (Fig. 3c), whereas the image of the disc with stellar inertia, which is not yet fragmented, conserves its round morphology (Fig. 3d).
At time 23.25 kyr, all the accretion disc models have undergone gravitational fragmentation; however, their thermal dust emission at 1.3 mm is quantitatively similar, despite clear morphological differences of the disc density fields. In both models, the infrared disc nebula reveals a bright central region with a global circular shape surrounded by bright spots that correspond to the migrating gaseous clumps (Figs. 3e, f). In the case of observations of accretion discs of massive stars, both conclude with the presence of a fragmenting disc around a massive protostar. It is interesting to note that the flying clump catapulted from the accretion disc modelled without stellar inertia (Fig. 1c) is not visible in the infrared, as the synthetic image of Figs. 3c, e demonstrates. This can be explained by the poorer numerical resolution of the outer regions of the computational domain compared to the inner disc region. Such a lack of resolution has long been the reason why local numerical simulations of massive star formation cannot consistently conclude on disc fragmentation (Krumholz et al. 2009b). The density and temperature contrast across the ejected clump washes out as it enters the outer regions with progressively lower numerical resolution, making it more difficult to detect. This possible explanation is strengthened by the images at time 24.35 kyr, which still displays two northern bright spots corresponding to two massive clumps (hence, dense and hot) surrounded by accretion structures in the disc (Fig. 2a), while the ejected lower-mass clump is not visible in the field of view.
Figure 4 shows plots of the later evolution of the disc as seen by ALMA at times 24.35 kyr (top series of panels), 27.55 kyr (middle series of panels), and 32.65 kyr (bottom series of panels). It essentially indicates that the increasing complexity of the accretion disc simulated without stellar inertia does not translate entirely into the millimetre images. For example, the very complex circumstellar patterns of Figs. 1 and 2 are not fully recognisable in Fig. 4c nor in Fig. 4e. Nevertheless, we note that a circumstellar disc around a gaseous clump located in the southern part of the disc in Fig. 4c appears as a circular, enrolled structure in Fig. 4c. This indicates that the surroundings of the circumstellar clumps that are in turn accreting disc material, that is, they are on their way to low-mass star formation and can be considered embryos of nascent secondary stars, could be observed with today’s available facilities. The disc substructure is barely visible at the later time 32.65 kyr in the model without stellar inertia, except in the vicinity of the protostar (Fig. 4e). On the other hand, the synthetic image of the accretion disc modelled with stellar inertia is well traced by the emission since it is denser and has therefore accumulated more dust mass from the infalling material, which reemits the protostellar light more efficiently. Hence, the discs are easier to be observed by ALMA.
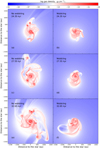 |
Fig. 2 Same as in Fig. 1 but for the time instances 24.35 (a, b), 27.55 (c, d), and 32.65 kyr (e, f). |
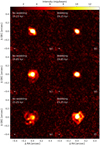 |
Fig. 3 Synthetic 1.2 mm dust continuum emission maps, as seen by the ALMA interferometer in its antenna configuration 10, of the accretion disc simulated without (left panels) and with (right panels) stellar inertia. The panels shown are for several time instances displayed in Fig. 1, namely, 19.15 kyr (a, b), 19.85 kyr (c, d), and 23.25 kyr (e, f). The distance to the source was assumed to be 1 kpc. |
4.2 Caveats of simulation method
The limitations of the methods used to produce the models presented in this study remain essentially the absence of the pre-stellar core magnetic field in the initial conditions, which is directly associated with the difficulty to include non-ideal effects, such as Ohmic diffusion and the Hall effect, in the early disc formation, as well as the use of a radiation transport scheme restricted to non-ionising photons. No disc wind or photoevaporation mechanism are present in the model. These caveats remain reasonably similar to those already presented in the preceding papers of this series (see, for example, Meyer et al. 2018). The most important improvement would be to include the magnetic field in the disc simulations since the photoionising feedback is principally relevant for the physics of the bipolar region growing perpendicularly to the circumstellar disc. Only then will the construction of sophisticated simulated disc images fine-tuned to particular objects be possible. Apart from the physical processes that are absent in our numerical model, potential future improvements could be the use of a computational grid without the midplane symmetry that was utilised in the present study and the adoption of a sink cell radius of value <20 au. This will better capture any vertical oscillations of the accretion disc and allow for study of the vertical effects of a non-aligned disc of massive protostars. Such an update would nonetheless solely be possible at the cost of a reduced time step and therefore a dramatic increase of the computational costs of the numerical simulations.
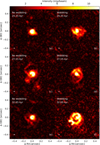 |
Fig. 4 Same as Fig. 3 but for the time instances displayed in displayed in Fig. 2, namely, 24.35 kyr (a, b), 27.55 kyr (c, d), and 32.65 kyr (e, f). |
4.3 Comparison with previous numerical works
The work of Mignon-Risse et al. (2023b) performs a comparison between the RAMSES and PLUTO codes regarding the initial gravitational collapse of a massive pre-stellar core, the first fragmentation era, and the disc fragmentation of the circumstellar disc based on the initial conditions and grid discretisation of the computational domain corresponding to the highest resolution simulation models of Oliva & Kuiper (2020). Both codes include similar microphysical processes, such as radiation transport with direct stellar irradiation, central gravity, and self-gravity of the gas. Sub-grid modules are included for disc fragmentation via sink particles, stellar evolution, and evolution of the dust component of the circumstellar material. The spatial resolution is the highest ever achieved for calculating disc fragmentation around a nascent massive star (Oliva & Kuiper 2020). Very good agreements between the two codes have been found during the early free-fall collapse of the pre-stellar core and the era of the first fragmentation. An overall satisfying match is reported in the properties of the disc fragments, testifying to the consistency in the radiation-hydrodynamical context with self-gravity of both RAMSES (Teyssier 2002; Fromang et al. 2006) and PLUTO (Mignone et al. 2007, 2012), despite differences in the numerical schemes used. Indeed, PLUTO utilises a ray-tracing method for direct irradiation with disc radiation transport by flux-limited diffusion (Kolb et al. 2013), while RAMSES is equipped with an M1 method (Rosdahl & Teyssier 2015) for protostellar feedback coupled to a flux-limited diffusion module (Mignon-Risse et al. 2020) for disc radiation physics. Whereas RAMSES operates on a Cartesian grid with adaptive mesh refinement, PLUTO works with a spherical grid with logarithmically expanding spacing in the radial direction. We refer the interested reader to Mignon-Risse et al. (2023b) for further details on the algorithm differences as well as a deep discussion on the advantages and conveniences of the calculation grids.
In the present paper, we compare two models computed using the PLUTO code with an implementation of the microphysical processes described in Meyer et al. (2022). We found a significant difference between the models without and with stellar inertia, which was previously reported in Meyer et al. (2022) based on lower-resolution simulations. Disc wobbling acts as an additional effect that results in slowing down and prolonging the development of gravitational instability in the accretion disc, reducing the number and magnitude of the accretion-driven bursts. This is consistent with the comparison of the accretion rate histories in Fig. 7 of Mignon-Risse et al. (2023b), which reports, despite a similar quiescent accretion rate, much milder accretion peaks onto the growing young massive star in the early 10 kyr of its existence and indicates a smaller mass of the circumstellar clumps forming in the disc. We interpret the difference in the dynamics of the disc fragments as originating from discrepancies in the central star mass of the stellar accretion models utilised in the two setups. Our results confirm the morphological difference and changing fragment patterns in the disc as a result of stellar wobbling, as noted by Meyer et al. (2022), with a spatial resolution that matches that of both the RAMSES and PLUTO models in Mignon-Risse et al. (2023b). We conclude that our results are consistent with the discrepancies noted in Mignon-Risse et al. (2023b) and propose that stellar wobbling is the factor that explains the differences between the RAMSES and PLUTO results.
4.4 Comparison with observations
The following section presents a comparison of the modelled accretion discs with several available observations of Keplerian structures around young massive stars. We focus on the discs of AFGL 4176 mm1, G17.64+0.16 and G353.2731.
4.4.1 The disc of AFGL 4176 mm1
The accretion disc surrounding the massive protostar AFGL 4176, also known as G308.918+0.123 or IRAS 13395-6153 and documented by Persi et al. (1986), exhibits circumstellar characteristics (Bøgelund et al. 2019) and follows a Keplerian pattern of rotation (Johnston et al. 2020). With a radius of approximately 1000 au, the disc features an asymmetric spiral arm detected through ALMA 1.2 mm emission (Johnston et al. 2020). The protostar is ≈25 M⊙, its surrounding disc is ≈12.5 M⊙, and it is located at a distance of ≈4.2 kpc (see Johnston et al. 2020). The disc spiral arm extends up to about 1000 au from the protostar, and it has an inner (≤900au) substructure, suggesting probable active disc fragmentation at work in the inner part. In our simulations, structures reaching radii of 1000 au are obtained at time ≥24.35 kyr when disc wobbling is excluded (Figs. 2c and e) and when gravitational fragmentation is very active in the disc. The disc in the model with stellar wobbling is in general more compact and features a spiral of comparable size to that of AFGL 4176 only at t = 32.65 kyr (Fig. 2f). However, these differences become less evident when synthetic images are compared (Fig. 4), and hence the model with wobbling can also be consistent with the spiral features of AFGL 4176.
4.4.2 The disc of G17.64+0.16
The surroundings of the massive (45 ± 10 M⊙) O-type protostar G17.64+0.16 have been shown via ALMA long-baseline observations at band 6 of H2O emission to be made of a disc structure whose material is characterised by Keplerian rotation around the central young star (Maud et al. 2019). As transitional discs often do in the context of low-mass protostars, this disc reveals a strong concentration of dust particles distributed in a ring-like outer region, which are possibly trapped by the pressure field, as well as clear dense substructures in the inner disc region. The Toomre analysis of the ≈100 pc-large disc in G17.64+0.16 shows that no gravitational instabilities are at work, and hence, it is not in a state of violent fragmentation. This apparent stability, despite the presence of substructures, is puzzling and challenges our results to some degree. The size of our accretion disc without stellar wobbling exceeds that of G17.64+0.16 when the first clump forms in the disc. On the other hand, such a large disc without strong fragmentation at work is found in our model with stellar inertia (see Figs. 1a, d). This makes stellar wobbling a necessary ingredient to reproduce the qualitative features of the circumstellar medium of G17.64+0.16.
The particularly high mass of G17.64+0.16 is also not in accordance with our series of models (see, for example, Fig. 2 in the study of Meyer et al. 2022, in which the mass of the protostar does not grow above ≈25 M⊙). Since (i) a higher initial ratio of rotational-to-gravitational energy results in the formation of protostars of lower mass but discs of larger size, as demonstrated in the parameter study of Meyer et al. (2021), and (ii) the disc of G17.64+0.16 is rather small and young, we conclude that the initial mass distribution of the G17.64+0.16 pre-stellar molecular core may have been drastically different from that in our models. Figures 2g, h of Meyer et al. (2021) shows that only molecular cores of initial mass greater than 180 M⊙ can produce protostars entering the high-mass regime during the core phase of free-fall gravitational collapse while reaching ≈35 M⊙ in their direct follow-up evolutionary phase. We propose that G17.64+0.16 has formed via the collapse of a massive (> 180 M⊙) but slowly rotating core.
4.4.3 The disc of G353.2731
High-resolution images with the Jansky Very Large Array (J-VLA) and the Australia Telescope Compact Array (ATCA) of the region of G353.2731 at radio continuum and maser emission have shown that its circumstellar medium is shaped as an accretion disc that is face-on regarding our observing line of sight (see the study of Motogi et al. 2017). The mass of the protostar has been constrained to be about 10 M⊙, and it is surrounded by an envelope. The inner region of the envelope, with a radius spanning distances of approximately ≈100 au, was interpreted in Motogi et al. (2017) to be smaller than the typical disc sizes predicted by previous numerical simulations. Indeed, the high-resolution models including radiative transport and detailed stellar irradiation of Meyer et al. (2018) have shown that spiral arms of such discs can easily reach ≈1000 au once fragmentation is at work. This is confirmed by our high-resolution model without stellar wobbling (Figs. 2c, e). Since the main effect of stellar inertia that we highlight in our study is to delay disc fragmentation and to produce discs of reduced size, we conclude that the small disc of G353.2731 is consistent with our work.
5 Conclusions
Through this paper, we have explored the effects of stellar inertia on the early development and fragmentation of circumstellar accretion discs around a massive protostar. We performed three-dimensional high-resolution numerical gravito-radiation-hydrodynamical simulations with the PLUTO code (Mignone et al. 2007, 2012; Vaidya et al. 2018). The models began at the onset of the gravitational collapse of a rotating molecular cloud with a kinetic-to-gravitational energy ratio β = 4% and were followed up to a time of about 32 kyr. The disc models presented the following two characteristic features: a high spatial resolution corresponding to the most highly resolved simulation using a spherical coordinate system (Mignon-Risse et al. 2023b) and a careful treatment of the gravitational interaction at work between the disc and the central young high-mass star (Meyer et al. 2022). The latter improvement was included as the acceleration that the protostar undergoes when interacting gravitationally with the non-axisymmteric accretion disc (Michael & Durisen 2010; Hosokawa et al. 2016; Regály & Vorobyov 2017). The effects on the disc morphology of the resulting stellar wobbling with respect to the coordinate centre was evaluated by producing synthetic millimetre ALMA observations of the star-disc system, which we discussed in the context of available observations.
We found notable differences between the disc structure with and without stellar wobbling. When the star is allowed to move, the development of gravitational instabilities is slowed down and delayed. The disc continues to display a small, round morphology, and the formation of spiral arms and gaseous clumps happens at later times compared to simulations performed without wobbling. This confirms the findings of Meyer et al. (2022) obtained on the basis of simulations with a lower resolution. High-resolution accretion discs modelled with stellar inertia generated a much simpler pattern. They contained less gaseous clumps, around which secondary disc-like nebulae do not form as easily and numerously as in the model with a fixed central star. Gaseous clumps ejected from the disc in the model without stellar wobbling Basu & Vorobyov (2012); Vorobyov (2016) are not found once stellar inertia is included in the model, at least for the kinetic-to-gravitational energy ratio that we considered (β = 4%).
Synthetic 1.2 mm images of thermal dust emission of circumstellar discs wherein stellar wobbling is considered turned out to be much more qualitatively consistent with real observations of the discs of massive protostars than the images produced in models without stellar inertia, where the star is fixed to the coordinate origin of the domain. This applies to the observations of the Keplerian circumstellar medium of AFGL 4176 mm1, G17.64+0.16, and G353.273. This study stresses the importance of spatial resolution in the study of accretion discs around massive protostars, and it demonstrates that including the star-to-disc gravitational interaction is a preponderant ingredient to account for in realistic modelling of the surroundings of young massive stellar objects.
Acknowledgements
We are thankful to the anonymous referee for comments that helped to improve the manuscript. The work of E.I.V. from UrFU for Sects. 3 and 4 was supported by the Russian Science Foundation, project no. 23-12-00258. The authors acknowledge the North-German Supercomputing Alliance (HLRN) for providing HPC resources that have contributed to the research results reported in this paper. This research made use of the PLUTO code developed at the University of Torino by A. Mignone (http://plutocode.ph.unito.it/) and of the RADMC-3D code developed at the University of Heidelberg by C. Dullemond (https://www.ita.uni-heidelberg.de/~dullemond/software/radmc-3d/). The figures have been produced using the Matplotlib plotting library for the Python programming language (https://matplotlib.org/). The data underlying this article will be shared on reasonable request to the corresponding author. This work has been supported by the grant PID2021-124581OB-I00 funded by MCIN/AEI/10.13039/501100011033 and 2021SGR00426 of the Generalitat de Catalunya. This work was also supported by the Spanish program Unidad de Excelencia María de Maeztu CEX2020-001058-M. This work also supported by MCIN with funding from European Union NextGeneration EU (PRTR-C17.I1). E.I.V. acknowledges support from the Russian Science Foundation, project no. 23-12-00258.
References
- Ahmadi, A., Beuther, H., Mottram, J. C., et al. 2018, A&A, 618, A46 [NASA ADS] [CrossRef] [EDP Sciences] [Google Scholar]
- Ahmadi, A., Kuiper, R., & Beuther, H. 2019, A&A, 632, A50 [NASA ADS] [CrossRef] [EDP Sciences] [Google Scholar]
- Basu, S., & Vorobyov, E. I. 2012, ApJ, 750, 30 [NASA ADS] [CrossRef] [Google Scholar]
- Bitsch, B., Morbidelli, A., Lega, E., & Crida, A. 2014, A&A, 564, A135 [NASA ADS] [CrossRef] [EDP Sciences] [Google Scholar]
- Bjorkman, J. E., & Wood, K. 2001, ApJ, 554, 615 [NASA ADS] [CrossRef] [Google Scholar]
- Bøgelund, E. G., Barr, A. G., Taquet, V., et al. 2019, A&A, 628, A2 [NASA ADS] [CrossRef] [EDP Sciences] [Google Scholar]
- Burns, R. A. 2018, in Astrophysical Masers: Unlocking the Mysteries of the Universe, eds. A. Tarchi, M. J. Reid, & P. Castangia, IAU Symposium, 336, 263 [NASA ADS] [Google Scholar]
- Burns, R. A., Handa, T., Imai, H., et al. 2017, MNRAS, 467, 2367 [NASA ADS] [Google Scholar]
- Caratti o Garatti, A., Stecklum, B., Linz, H., Garcia Lopez, R., & Sanna, A. 2015, A&A, 573, A82 [NASA ADS] [CrossRef] [EDP Sciences] [Google Scholar]
- Cesaroni, R., Hofner, P., Araya, E., & Kurtz, S. 2010, A&A, 509, A50 [NASA ADS] [CrossRef] [EDP Sciences] [Google Scholar]
- Chen, X., Ren, Z., Zhang, Q., Shen, Z., & Qiu, K. 2017, ApJ, 835, 227 [NASA ADS] [CrossRef] [Google Scholar]
- Chini, R., Hoffmeister, V. H., Nasseri, A., Stahl, O., & Zinnecker, H. 2012, MNRAS, 424, 1925 [Google Scholar]
- Commerçon, B., Teyssier, R., Audit, E., Hennebelle, P., & Chabrier, G. 2011a, A&A, 529, A35 [NASA ADS] [CrossRef] [EDP Sciences] [Google Scholar]
- Commerçon, B., Hennebelle, P., & Henning, T. 2011b, ApJ, 742, L9 [CrossRef] [Google Scholar]
- Commerçon, B., González, M., Mignon-Risse, R., Hennebelle, P., & Vaytet, N. 2022, A&A, 658, A52 [NASA ADS] [CrossRef] [EDP Sciences] [Google Scholar]
- Cunningham, N. J., Moeckel, N., & Bally, J. 2009, ApJ, 692, 943 [NASA ADS] [CrossRef] [Google Scholar]
- Dong, R., Vorobyov, E., Pavlyuchenkov, Y., Chiang, E., & Liu, H. B. 2016, ApJ, 823, 141 [NASA ADS] [CrossRef] [Google Scholar]
- Dullemond, C. P. 2012, RADMC-3D: A multi-purpose radiative transfer tool, Astrophysics Source Code Library [record ascl:1202.015] [Google Scholar]
- Elbakyan, V. G., Vorobyov, E. I., Rab, C., et al. 2019, MNRAS, 484, 146 [NASA ADS] [CrossRef] [Google Scholar]
- Elbakyan, V. G., Nayakshin, S., Vorobyov, E. I., Caratti o Garatti, A., & Eislöffel, J. 2021, A&A, 651, L3 [NASA ADS] [CrossRef] [EDP Sciences] [Google Scholar]
- Elbakyan, V. G., Nayakshin, S., Meyer, D. M. A., & Vorobyov, E. I. 2023, MNRAS, 518, 791 [Google Scholar]
- Flock, M., Fromang, S., González, M., & Commerçon, B. 2013, A&A, 560, A43 [NASA ADS] [CrossRef] [EDP Sciences] [Google Scholar]
- Forgan, D. H., Ilee, J. D., Cyganowski, C. J., Brogan, C. L., & Hunter, T. R. 2016, MNRAS, 463, 957 [Google Scholar]
- Fromang, S., Hennebelle, P., & Teyssier, R. 2006, A&A, 457, 371 [NASA ADS] [CrossRef] [EDP Sciences] [Google Scholar]
- Ginsburg, A., Bally, J., Goddi, C., Plambeck, R., & Wright, M. 2018, ApJ, 860, 119 [NASA ADS] [CrossRef] [Google Scholar]
- Guadarrama, R., Vorobyov, E. I., Rab, C., et al. 2024, A&A, 684, A51 [NASA ADS] [CrossRef] [EDP Sciences] [Google Scholar]
- Harries, T. J. 2015, MNRAS, 448, 3156 [NASA ADS] [CrossRef] [Google Scholar]
- Harries, T. J., Douglas, T. A., & Ali, A. 2017, MNRAS, 471, 4111 [NASA ADS] [CrossRef] [Google Scholar]
- Hennebelle, P., Commerçon, B., Chabrier, G., & Marchand, P. 2016, ApJ, 830, L8 [Google Scholar]
- Hirano, S., Hosokawa, T., Yoshida, N., & Kuiper, R. 2017, Science, 357, 1375 [CrossRef] [Google Scholar]
- Hosokawa, T., & Omukai, K. 2009, ApJ, 691, 823 [Google Scholar]
- Hosokawa, T., Yorke, H. W., & Omukai, K. 2010, ApJ, 721, 478 [Google Scholar]
- Hosokawa, T., Hirano, S., Kuiper, R., et al. 2016, ApJ, 824, 119 [NASA ADS] [CrossRef] [Google Scholar]
- Ilee, J. D., Cyganowski, C. J., Nazari, P., et al. 2016, MNRAS, 462, 4386 [NASA ADS] [CrossRef] [Google Scholar]
- Ilee, J. D., Cyganowski, C. J., Brogan, C. L., et al. 2018, ApJ, 869, L24 [Google Scholar]
- Jankovic, M. R., Haworth, T. J., Ilee, J. D., et al. 2019, MNRAS, 482, 4673 [NASA ADS] [CrossRef] [Google Scholar]
- Johnson, B. M., & Gammie, C. F. 2003, ApJ, 597, 131 [Google Scholar]
- Johnston, K. G., Robitaille, T. P., Beuther, H., et al. 2015, ApJ, 813, L19 [Google Scholar]
- Johnston, K. G., Hoare, M. G., Beuther, H., et al. 2020, ApJ, 896, 35 [Google Scholar]
- Keto, E., & Wood, K. 2006, ApJ, 637, 850 [NASA ADS] [CrossRef] [Google Scholar]
- Klassen, M., Kuiper, R., Pudritz, R. E., et al. 2014, ApJ, 797, 4 [NASA ADS] [CrossRef] [Google Scholar]
- Klassen, M., Pudritz, R. E., Kuiper, R., Peters, T., & Banerjee, R. 2016, ApJ, 823, 28 [NASA ADS] [CrossRef] [Google Scholar]
- Kobulnicky, H. A., Kiminki, D. C., Lundquist, M. J., et al. 2014, ApJS, 213, 34 [Google Scholar]
- Kolb, S. M., Stute, M., Kley, W., & Mignone, A. 2013, A&A, 559, A80 [NASA ADS] [CrossRef] [EDP Sciences] [Google Scholar]
- Kraus, S., Kluska, J., Kreplin, A., et al. 2017, ApJ, 835, L5 [Google Scholar]
- Krumholz, M. R., Klein, R. I., & McKee, C. F. 2007a, ApJ, 665, 478 [NASA ADS] [CrossRef] [Google Scholar]
- Krumholz, M. R., Klein, R. I., & McKee, C. F. 2007b, ApJ, 656, 959 [NASA ADS] [CrossRef] [Google Scholar]
- Krumholz, M. R., Klein, R. I., McKee, C. F., Offner, S. S. R., & Cunningham, A. J. 2009a, Science, 323, 754 [Google Scholar]
- Krumholz, M. R., Klein, R. I., McKee, C. F., Offner, S. S. R., & Cunningham, A. J. 2009b, Science, 323, 754 [Google Scholar]
- Kuiper, R., & Yorke, H. W. 2013a, ApJ, 763, 104 [NASA ADS] [CrossRef] [Google Scholar]
- Kuiper, R., & Yorke, H. W. 2013b, ApJ, 772, 61 [Google Scholar]
- Kuiper, R., Klahr, H., Beuther, H., & Henning, T. 2010a, ApJ, 722, 1556 [NASA ADS] [CrossRef] [Google Scholar]
- Kuiper, R., Klahr, H., Dullemond, C., Kley, W., & Henning, T. 2010b, A&A, 511, A81 [NASA ADS] [CrossRef] [EDP Sciences] [Google Scholar]
- Kuiper, R., Klahr, H., Beuther, H., & Henning, T. 2011, ApJ, 732, 20 [CrossRef] [Google Scholar]
- Laor, A., & Draine, B. T. 1993, ApJ, 402, 441 [NASA ADS] [CrossRef] [Google Scholar]
- Machida, M. N., ichiro Inutsuka, S., & Matsumoto, T. 2011, ApJ, 729, 42 [NASA ADS] [CrossRef] [Google Scholar]
- Mahy, L., Rauw, G., De Becker, M., Eenens, P., & Flores, C. A. 2013, A&A, 550, A27 [NASA ADS] [CrossRef] [EDP Sciences] [Google Scholar]
- Maud, L. T., Hoare, M. G., Galván-Madrid, R., et al. 2017, MNRAS, 467, L120 [NASA ADS] [Google Scholar]
- Maud, L. T., Cesaroni, R., Kumar, M. S. N., et al. 2018, A&A, 620, A31 [NASA ADS] [CrossRef] [EDP Sciences] [Google Scholar]
- Maud, L. T., Cesaroni, R., Kumar, M. S. N., et al. 2019, A&A, 627, L6 [NASA ADS] [CrossRef] [EDP Sciences] [Google Scholar]
- McMullin, J. P., Waters, B., Schiebel, D., Young, W., & Golap, K. 2007, in Astronomical Data Analysis Software and Systems XVI, eds. R. A. Shaw, F. Hill, & D. J. Bell, Astronomical Society of the Pacific Conference Series, 376, 127 [NASA ADS] [Google Scholar]
- Meyer, D. M.-A., Vorobyov, E. I., Kuiper, R., & Kley, W. 2017, MNRAS, 464, L90 [NASA ADS] [CrossRef] [Google Scholar]
- Meyer, D. M.-A., Kuiper, R., Kley, W., Johnston, K. G., & Vorobyov, E. 2018, MNRAS, 473, 3615 [Google Scholar]
- Meyer, D. M. A., Haemmerlé, L., & Vorobyov, E. I. 2019a, MNRAS, 484, 2482 [Google Scholar]
- Meyer, D. M. A., Kreplin, A., Kraus, S., et al. 2019b, MNRAS, 487, 4473 [NASA ADS] [CrossRef] [Google Scholar]
- Meyer, D. M.-A., Vorobyov, E. I., Elbakyan, V. G., et al. 2019c, MNRAS, 482, 5459 [NASA ADS] [CrossRef] [Google Scholar]
- Meyer, D. M. A., Vorobyov, E. I., Elbakyan, V. G., et al. 2021, MNRAS, 500, 4448 [Google Scholar]
- Meyer, D. M. A., Vorobyov, E. I., Elbakyan, V. G., et al. 2022, MNRAS, 517, 4795 [NASA ADS] [CrossRef] [Google Scholar]
- Michael, S., & Durisen, R. H. 2010, MNRAS, 406, 279 [Google Scholar]
- Mignon-Risse, R., González, M., Commerçon, B., & Rosdahl, J. 2020, A&A, 635, A42 [NASA ADS] [CrossRef] [EDP Sciences] [Google Scholar]
- Mignon-Risse, R., González, M., Commerçon, B., & Rosdahl, J. 2021, A&A, 652, A69 [NASA ADS] [CrossRef] [EDP Sciences] [Google Scholar]
- Mignon-Risse, R., González, M., & Commerçon, B. 2023a, A&A, 673, A134 [NASA ADS] [CrossRef] [EDP Sciences] [Google Scholar]
- Mignon-Risse, R., Oliva, A., González, M., Kuiper, R., & Commerçon, B. 2023b, A&A, 672, A88 [NASA ADS] [CrossRef] [EDP Sciences] [Google Scholar]
- Mignone, A., Bodo, G., Massaglia, S., et al. 2007, ApJS, 170, 228 [Google Scholar]
- Mignone, A., Zanni, C., Tzeferacos, P., et al. 2012, ApJS, 198, 7 [Google Scholar]
- Motogi, K., Hirota, T., Sorai, K., et al. 2017, ApJ, 849, 23 [CrossRef] [Google Scholar]
- Nayakshin, S. 2010, MNRAS, 408, L36 [NASA ADS] [CrossRef] [Google Scholar]
- Nayakshin, S. 2016, MNRAS, 461, 3194 [NASA ADS] [CrossRef] [Google Scholar]
- Nayakshin, S. 2017, PASA, 34, e002 [NASA ADS] [CrossRef] [Google Scholar]
- Nayakshin, S., & Lodato, G. 2012, MNRAS, 426, 70 [Google Scholar]
- Oliva, G. A., & Kuiper, R. 2020, A&A, 644, A41 [NASA ADS] [CrossRef] [EDP Sciences] [Google Scholar]
- Oliva, A., & Kuiper, R. 2023a, A&A, 669, A80 [NASA ADS] [CrossRef] [EDP Sciences] [Google Scholar]
- Oliva, A., & Kuiper, R. 2023b, A&A, 669, A81 [NASA ADS] [CrossRef] [EDP Sciences] [Google Scholar]
- Papaloizou, J. C., & Savonije, G. J. 1991, MNRAS, 248, 353 [Google Scholar]
- Persi, P., Ferrari-Toniolo, M., & Spinoglio, L. 1986, A&A, 157, 29 [NASA ADS] [Google Scholar]
- Peters, T., Banerjee, R., Klessen, R. S., et al. 2010, ApJ, 711, 1017 [NASA ADS] [CrossRef] [Google Scholar]
- Pickett, B. K., Mejía, A. C., Durisen, R. H., et al. 2003, ApJ, 590, 1060 [NASA ADS] [CrossRef] [Google Scholar]
- Purser, S. J. D., Lumsden, S. L., Hoare, M. G., et al. 2016, MNRAS, 460, 1039 [NASA ADS] [CrossRef] [Google Scholar]
- Purser, S. J. D., Lumsden, S. L., Hoare, M. G., & Cunningham, N. 2018, MNRAS, 475, 2 [NASA ADS] [CrossRef] [Google Scholar]
- Rafikov, R. R. 2005, ApJ, 621, L69 [Google Scholar]
- Rafikov, R. R. 2007, ApJ, 662, 642 [NASA ADS] [CrossRef] [Google Scholar]
- Regály, Z., & Vorobyov, E. 2017, A&A, 601, A24 [NASA ADS] [CrossRef] [EDP Sciences] [Google Scholar]
- Reiter, M., Kiminki, M. M., Smith, N., & Bally, J. 2017, MNRAS, 470, 4671 [NASA ADS] [CrossRef] [Google Scholar]
- Rosdahl, J., & Teyssier, R. 2015, MNRAS, 449, 4380 [Google Scholar]
- Rosen, A. L., Krumholz, M. R., McKee, C. F., & Klein, R. I. 2016, MNRAS, 463, 2553 [NASA ADS] [CrossRef] [Google Scholar]
- Samal, M. R., Chen, W. P., Takami, M., Jose, J., & Froebrich, D. 2018, MNRAS, 477, 4577 [CrossRef] [Google Scholar]
- Seifried, D., Banerjee, R., Klessen, R. S., Duffin, D., & Pudritz, R. E. 2011, MNRAS, 417, 1054 [NASA ADS] [CrossRef] [Google Scholar]
- Seifried, D., Pudritz, R. E., Banerjee, R., Duffin, D., & Klessen, R. S. 2012, MNRAS, 422, 347 [NASA ADS] [CrossRef] [Google Scholar]
- Seifried, D., Banerjee, R., Pudritz, R. E., & Klessen, R. S. 2013, MNRAS, 432, 3320 [NASA ADS] [CrossRef] [Google Scholar]
- Seifried, D., Banerjee, R., Pudritz, R. E., & Klessen, R. S. 2015, MNRAS, 446, 2776 [NASA ADS] [CrossRef] [Google Scholar]
- Stecklum, B., Heese, S., Wolf, S., et al. 2017, arXiv e-prints [arXiv:1712.01451] [Google Scholar]
- Teyssier, R. 2002, A&A, 385, 337 [CrossRef] [EDP Sciences] [Google Scholar]
- Vaidya, B., Fendt, C., Beuther, H., & Porth, O. 2011, ApJ, 742, 56 [NASA ADS] [CrossRef] [Google Scholar]
- Vaidya, B., Mignone, A., Bodo, G., Rossi, P., & Massaglia, S. 2018, ApJ, 865, 144 [Google Scholar]
- Vorobyov, E. I. 2016, A&A, 590, A115 [NASA ADS] [CrossRef] [EDP Sciences] [Google Scholar]
- Vorobyov, E. I., & Basu, S. 2005, ApJ, 633, L137 [NASA ADS] [CrossRef] [Google Scholar]
- Vorobyov, E. I. & Basu, S. 2006, ApJ, 650, 956 [CrossRef] [Google Scholar]
- Vorobyov, E. I., & Basu, S. 2010, ApJ, 719, 1896 [NASA ADS] [CrossRef] [Google Scholar]
- Vorobyov, E. I., & Basu, S. 2015, ApJ, 805, 115 [NASA ADS] [CrossRef] [Google Scholar]
- Vorobyov, E. I., & Elbakyan, V. G. 2018, A&A, 618, A7 [NASA ADS] [CrossRef] [EDP Sciences] [Google Scholar]
- Vorobyov, E. I., DeSouza, A. L., & Basu, S. 2013, ApJ, 768, 131 [NASA ADS] [CrossRef] [Google Scholar]
All Tables
All Figures
|
Fig. 1 Midplane density fields (in g cm−3) in the accretion disc hydrodynamical simulations performed without (left panels) and with (right panels) stellar inertia. The figures are shown for several time instances, namely, 19.15 (a, b), 19.85 (c, d), and 23.25 kyr (e, f). The initial kinetic-to-gravitational energy ratio of the collapsing molecular cloud is β = 4%. |
| In the text | |
|
Fig. 2 Same as in Fig. 1 but for the time instances 24.35 (a, b), 27.55 (c, d), and 32.65 kyr (e, f). |
| In the text | |
|
Fig. 3 Synthetic 1.2 mm dust continuum emission maps, as seen by the ALMA interferometer in its antenna configuration 10, of the accretion disc simulated without (left panels) and with (right panels) stellar inertia. The panels shown are for several time instances displayed in Fig. 1, namely, 19.15 kyr (a, b), 19.85 kyr (c, d), and 23.25 kyr (e, f). The distance to the source was assumed to be 1 kpc. |
| In the text | |
|
Fig. 4 Same as Fig. 3 but for the time instances displayed in displayed in Fig. 2, namely, 24.35 kyr (a, b), 27.55 kyr (c, d), and 32.65 kyr (e, f). |
| In the text | |
Current usage metrics show cumulative count of Article Views (full-text article views including HTML views, PDF and ePub downloads, according to the available data) and Abstracts Views on Vision4Press platform.
Data correspond to usage on the plateform after 2015. The current usage metrics is available 48-96 hours after online publication and is updated daily on week days.
Initial download of the metrics may take a while.