Fig. 8
Download original image
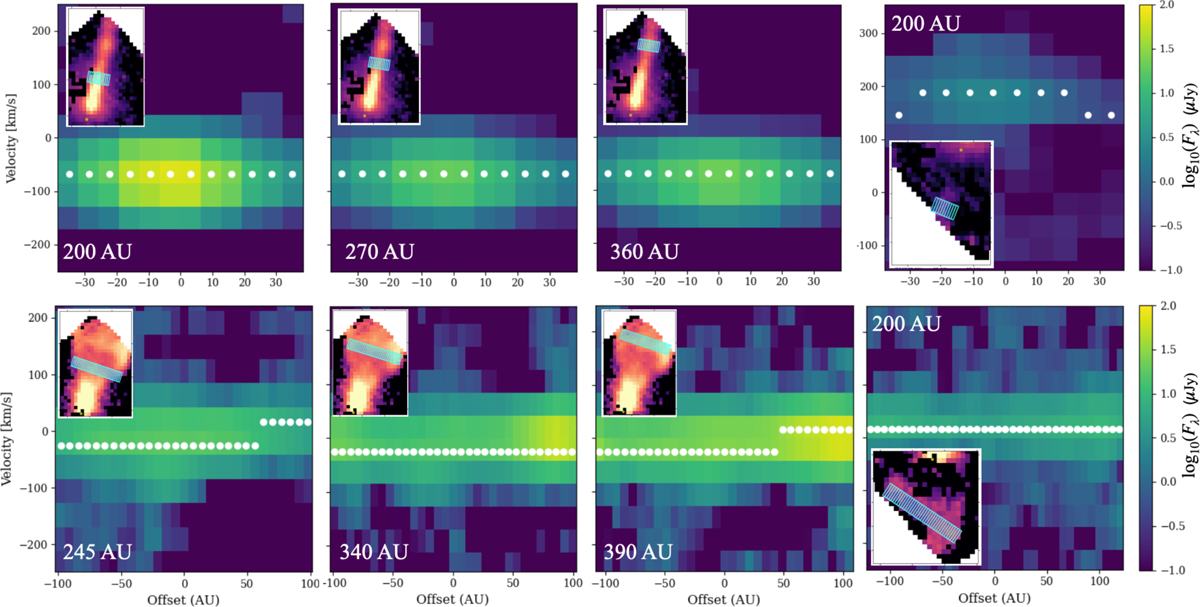
PV diagrams of the 1.644 µm [Fe II] (top row) and 2.803 µm H2 (bottom row) lines at different locations in the bipolar jet. The distance offset from the jet axis is calculated by adopting a distance of 140 pc without de-projection since the slices are taken perpendicular to the jet. The de-projected offsets are shown in the bottom left of each panel. In each panel, the integrated flux density or moment-0 maps are shown in the inset along with the region that the PV diagram was taken which has a width of 4 spaxels.
Current usage metrics show cumulative count of Article Views (full-text article views including HTML views, PDF and ePub downloads, according to the available data) and Abstracts Views on Vision4Press platform.
Data correspond to usage on the plateform after 2015. The current usage metrics is available 48-96 hours after online publication and is updated daily on week days.
Initial download of the metrics may take a while.