Fig. 7
Download original image
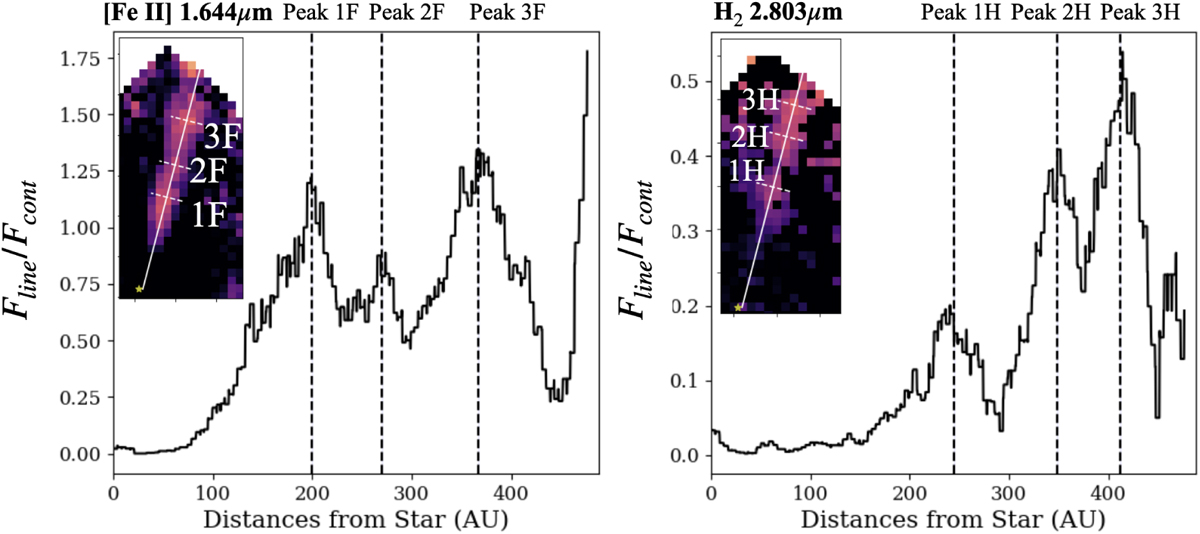
Peaks in the [Fe II] (left) and H2 (right) outflows. The flux density profile of the highest velocity emission as a function of the deprojected distance along the jet’s axis (−150 km s−1 for [Fe II], −110 km s−1 for H2) is shown normalized with respect to the dust continuum. The inset in each panel shows the flux density maps with color maps logarithmically spaced from 10−2 to 10 µJy. The dashed vertical lines correspond to the peak (central) position of each peak determined by fitting Gaussian profile to the flux density profile (Fline/Fcont vs distance). The same locations are indicated by the white dashed lines in the flux density map in the inset.
Current usage metrics show cumulative count of Article Views (full-text article views including HTML views, PDF and ePub downloads, according to the available data) and Abstracts Views on Vision4Press platform.
Data correspond to usage on the plateform after 2015. The current usage metrics is available 48-96 hours after online publication and is updated daily on week days.
Initial download of the metrics may take a while.