Fig. 3
Download original image
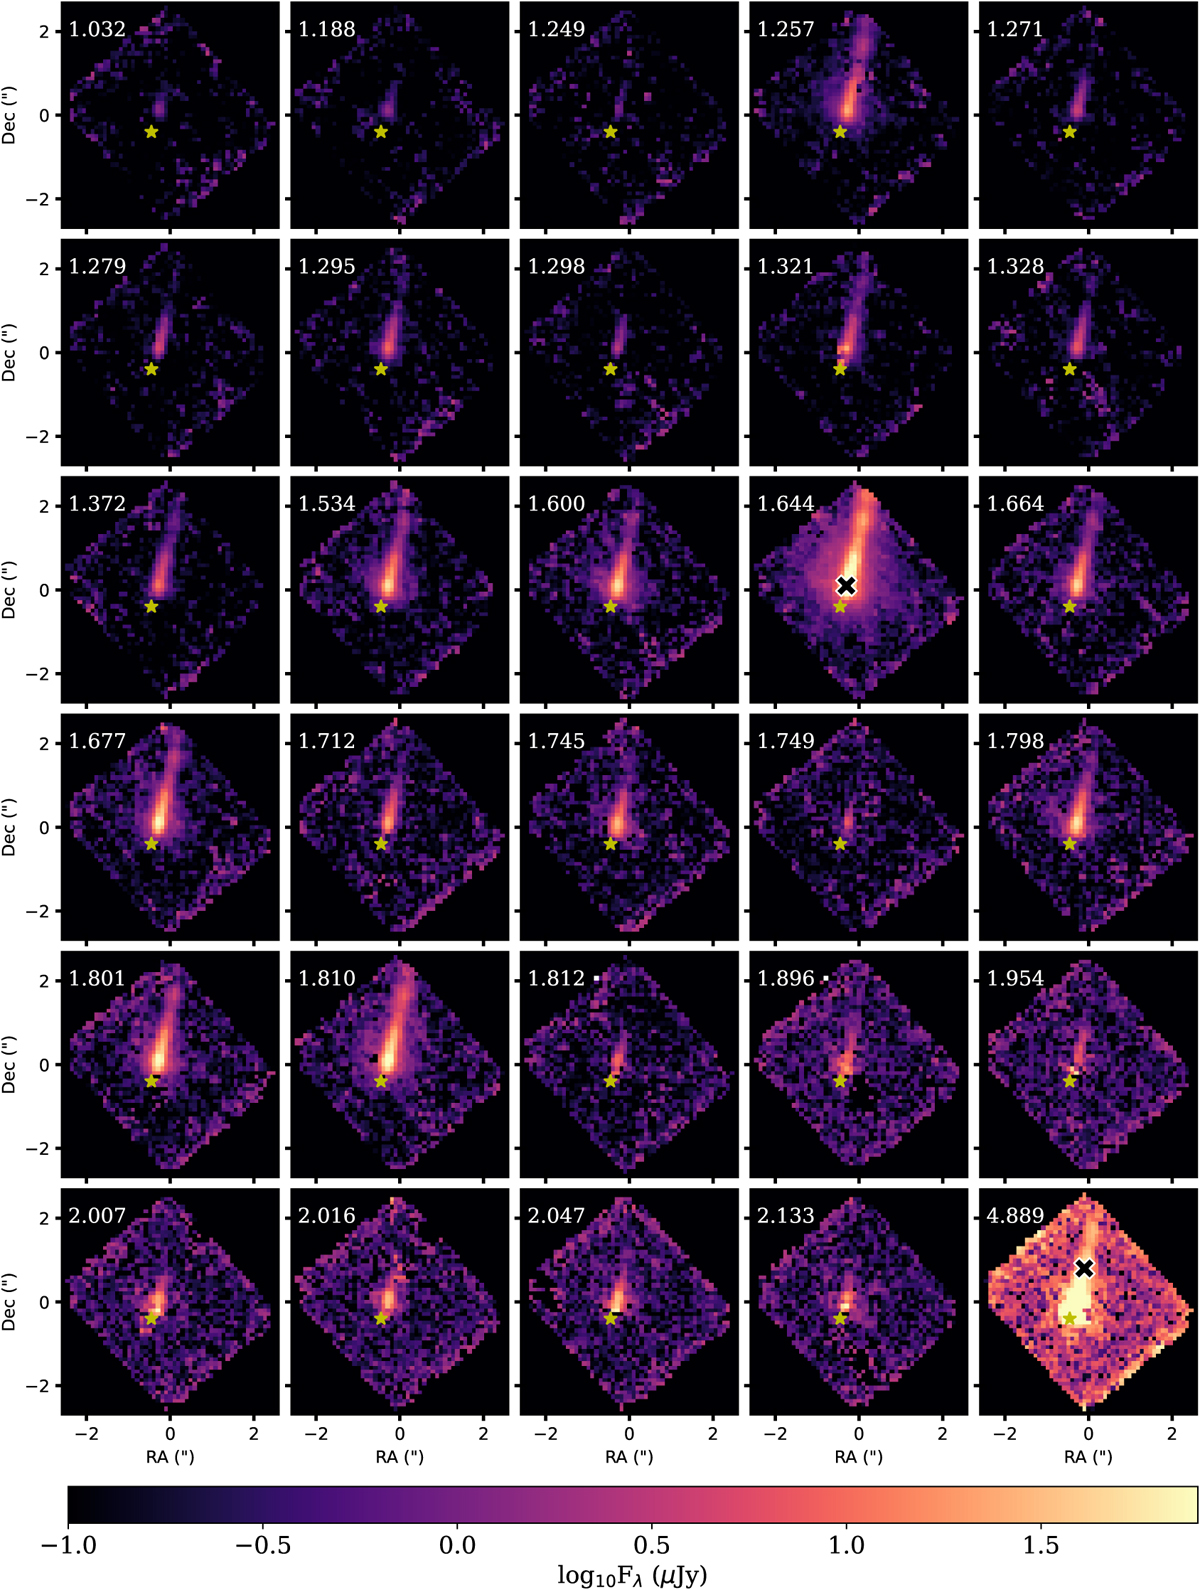
Each panel shows the peak flux density map of the detected [Fe II] lines with an S /N ≥ 3 and bad pixels masked out. The black cross (×) with white borders in the panel for the 1.644 µm line denotes the spaxel used to extract the 1D spectra in Fig. 2. A different spaxel is used to extract the 4.89 µm line profile since it is affected by contamination closer to the protostar. The redshifted or southern part of the outflow discussed in later sections (see Sect. 3.2) does not appear in these maps since we plotted the flux density maps at the velocity corresponding to the peak line flux for a spaxel located in the blueshifted side of the jet. The rest wavelength in microns of each line is overplotted in the upper left of each panel.
Current usage metrics show cumulative count of Article Views (full-text article views including HTML views, PDF and ePub downloads, according to the available data) and Abstracts Views on Vision4Press platform.
Data correspond to usage on the plateform after 2015. The current usage metrics is available 48-96 hours after online publication and is updated daily on week days.
Initial download of the metrics may take a while.