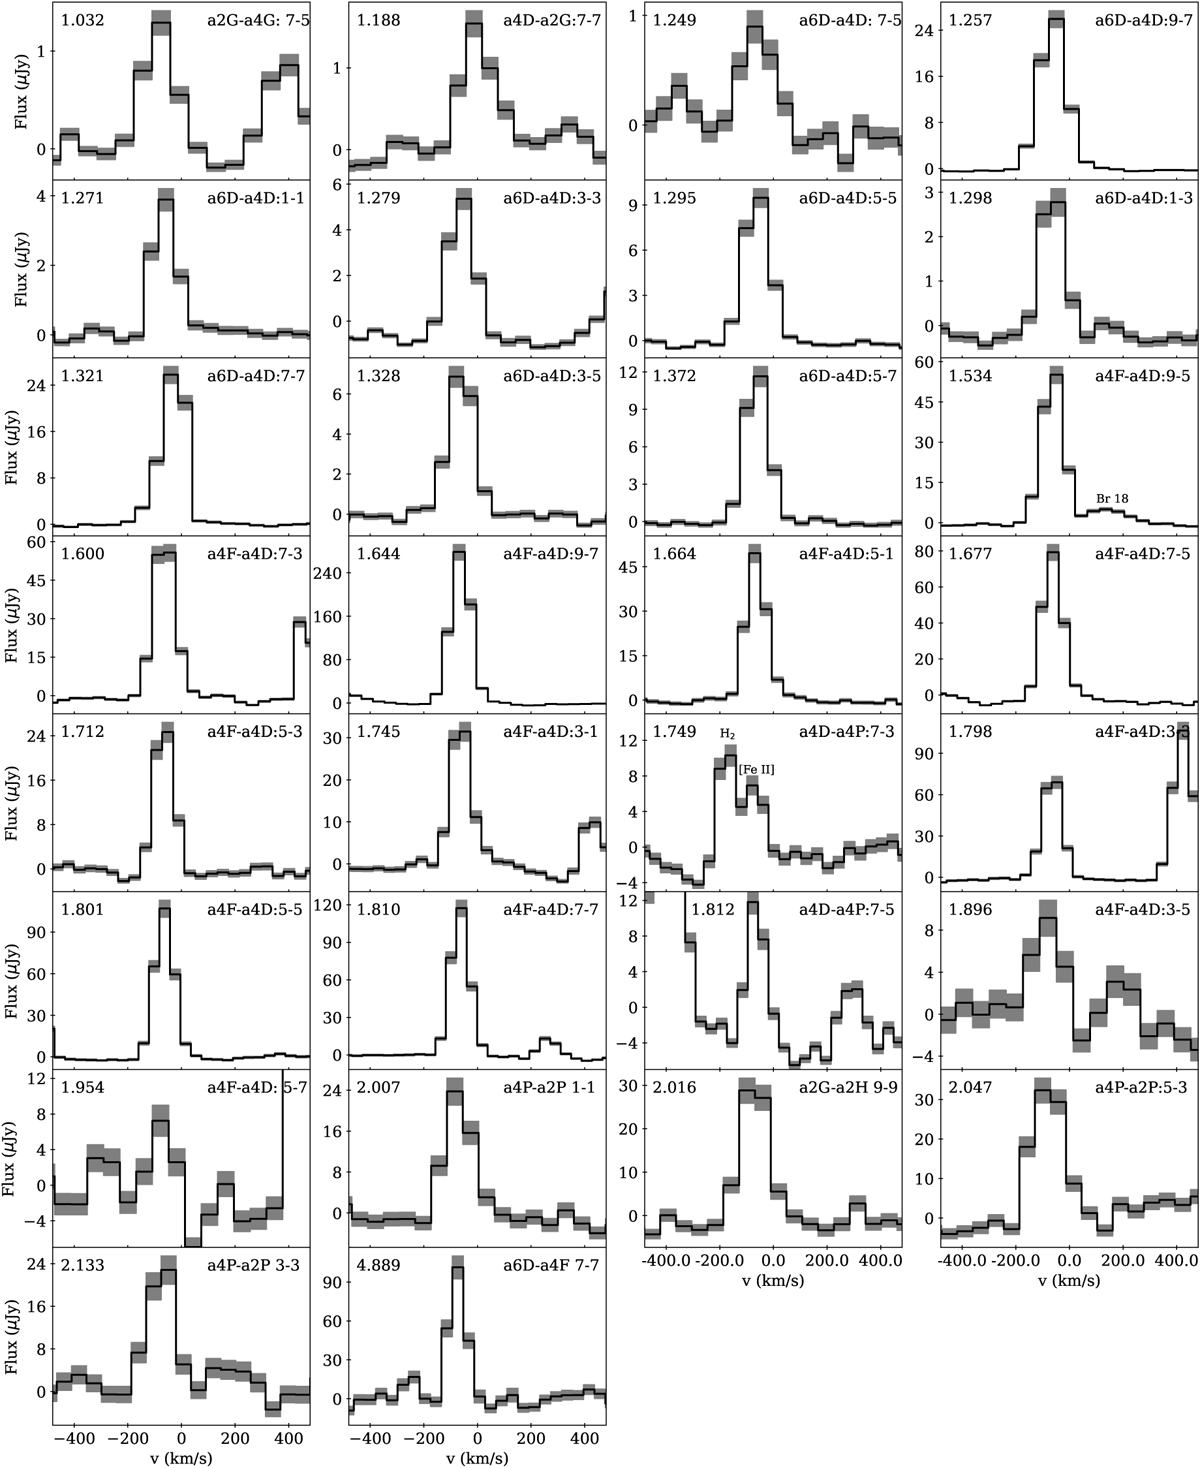
Fig. 2
Download original image
Detected [Fe II] emission lines in order of increasing wavelength. Each panel shows a spectrum taken in the northern part of the outflow along the jet axis (~0.5 arcsec away from the protostar). The location of the spaxel is shown as a cross (×) in the panel of the 1.644 µm line of Fig. 3. Meanwhile, the 4.889 µm spectrum is extracted from a location that is marked by the cross in the panel for the 4.889 µm in Fig. 3 to avoid the contamination by the CO fundamental ro-vibrational line. Velocities are calculated independently for each line with respect to the rest wavelength (see Table A.1). The wavelength in microns is given in the upper left of each panel, and the transition terms are given in the upper right and summarized in Table A.1. The 1.749 µm line is blended with the H2 1–0 S(7) line and each is labeled in the inset. Similarly the Br 18 hydrogen recombination line is denoted in the 1.534 µm line. The 1σ uncertainty including a 5% calibration uncertainty is shown by the shaded region.
Current usage metrics show cumulative count of Article Views (full-text article views including HTML views, PDF and ePub downloads, according to the available data) and Abstracts Views on Vision4Press platform.
Data correspond to usage on the plateform after 2015. The current usage metrics is available 48-96 hours after online publication and is updated daily on week days.
Initial download of the metrics may take a while.