Fig. 10
Download original image
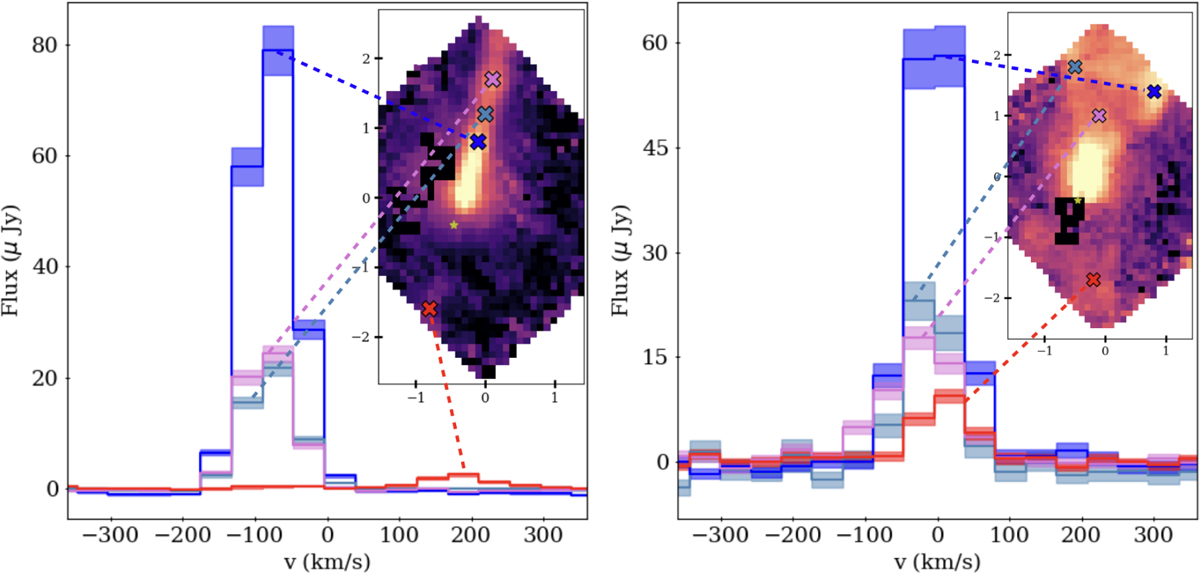
Line profiles of the 1.644 µm [Fe II] (left) and 2.803 µm H2 (right) lines at different locations. The spectra are color-coded and correspond to the locations marked by cross (×) in the moment-0 maps shown in the insets. The spectra are extracted in different locations for the [Fe II] and H2 lines to highlight particular characteristics. In the left panel, these correspond to the three brightness peaks along the blueshiſted jet axis (blue, steel blue, purple) and redshifted jet (red). In the right panel, the spectra correspond to the central spine with higher velocity emission detected (purple), the left (steel blue) and right (blue) wings of the ring-like structure, and the redshiſted outflow (red).
Current usage metrics show cumulative count of Article Views (full-text article views including HTML views, PDF and ePub downloads, according to the available data) and Abstracts Views on Vision4Press platform.
Data correspond to usage on the plateform after 2015. The current usage metrics is available 48-96 hours after online publication and is updated daily on week days.
Initial download of the metrics may take a while.