Fig. 1
Download original image
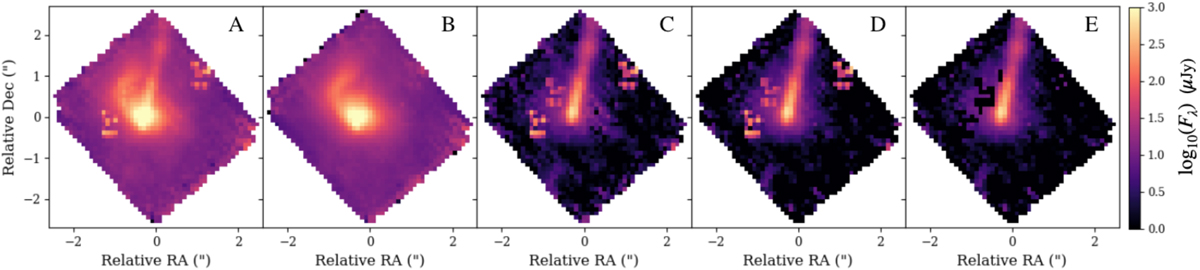
Illustration of the data reduction process for the 1.644 µm [Fe II] line. (A) Integrated flux density maps (moment 0) of the line after the pipeline. (B) Result of the continuum fit. (C) Continuum-subtracted emission map. (D) Continuum-subtracted map with an S/N cut (Fλ ≥ 3). (E) Zeroth moment map after removal of bad spaxels.
Current usage metrics show cumulative count of Article Views (full-text article views including HTML views, PDF and ePub downloads, according to the available data) and Abstracts Views on Vision4Press platform.
Data correspond to usage on the plateform after 2015. The current usage metrics is available 48-96 hours after online publication and is updated daily on week days.
Initial download of the metrics may take a while.