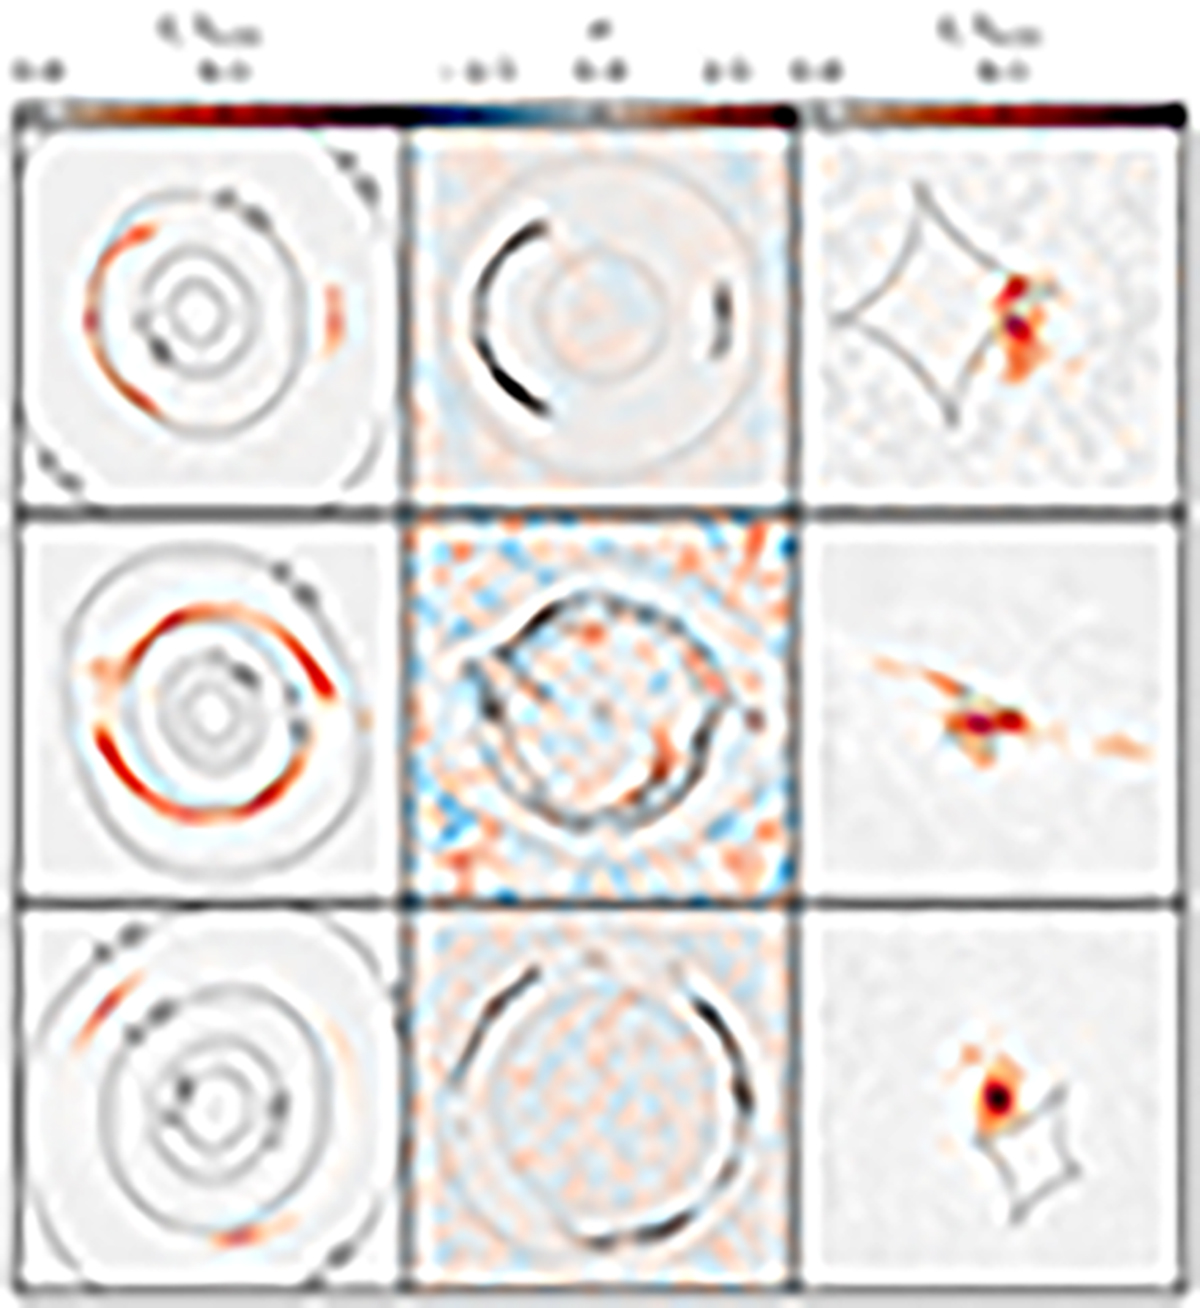
Fig. 2.
Download original image
Maximum a posteriori PL+MP lens models. Rows, from top to bottom: SDP 81, SPT 0532−50, and SPT 0538−50. First column: model lensed surface brightness distribution, with contours of the convergence in units of the critical surface-mass density in black. Second column: noise-normalised residuals (data−model); black contours show the model lensed surface brightness distribution; dashed grey contours show the mask. Third column: model source surface brightness distribution, with caustics in black. The colour scale is the same for each column.
Current usage metrics show cumulative count of Article Views (full-text article views including HTML views, PDF and ePub downloads, according to the available data) and Abstracts Views on Vision4Press platform.
Data correspond to usage on the plateform after 2015. The current usage metrics is available 48-96 hours after online publication and is updated daily on week days.
Initial download of the metrics may take a while.