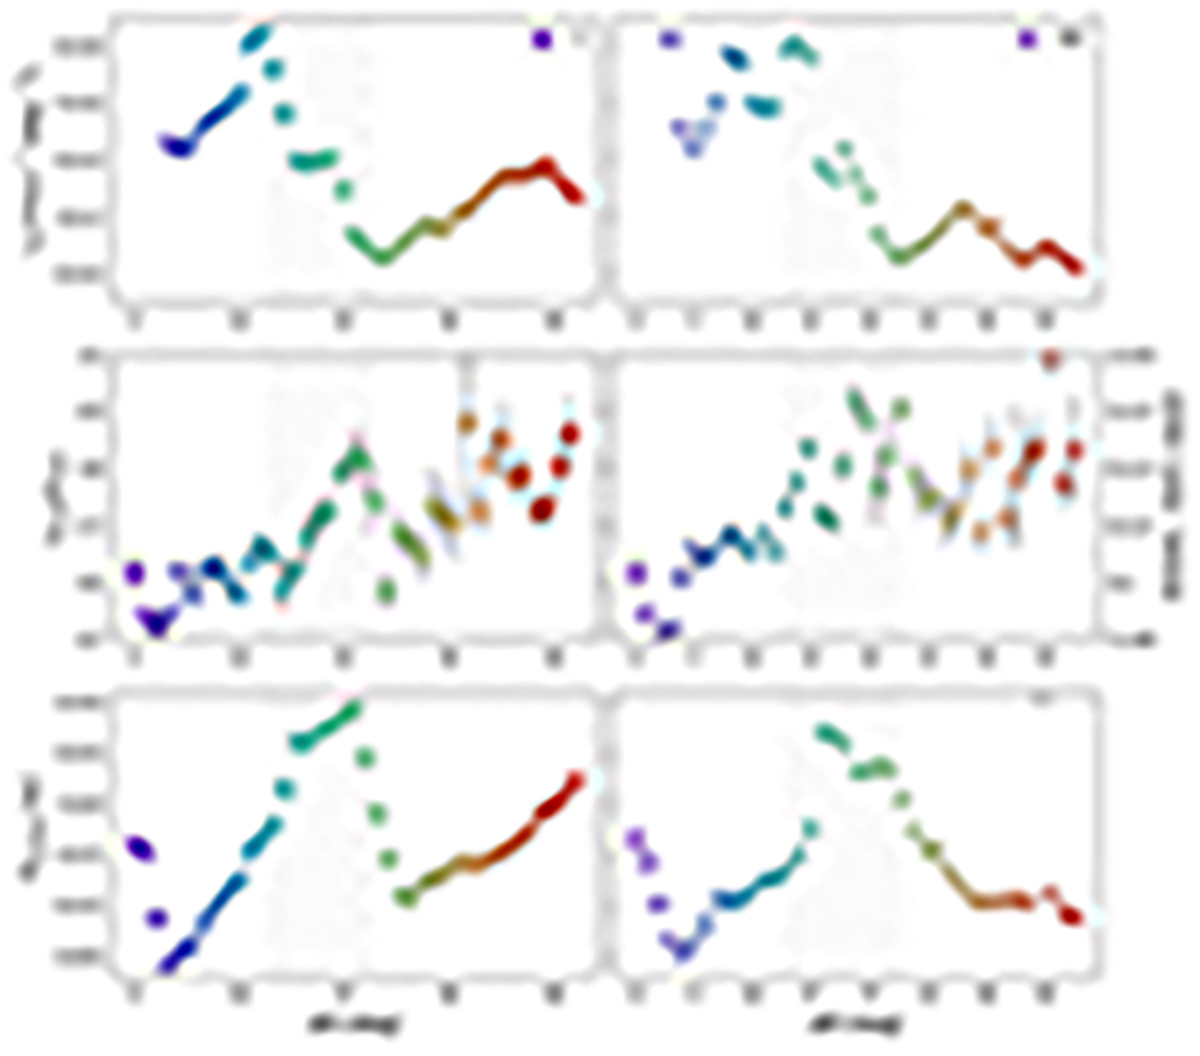
Fig. 9.
Download original image
Radial profiles across the bright arc found within the Goat Horn complex. The sky paths from which the profiles were extracted are shown in Fig. 6. The rainbow colors match the data in this figure. Δθ ≡ 0 is defined at coordinates (l, b) = (280, −34). The hatched area shows the region dominated by a sharp intensity transition in the X-ray data. Top panel: eROSITA soft X-ray intensity (0.5–1.0 keV). Central panel: temperature proxy (right vertical axis), as derived from the ratio of eROSITA narrow-band images centered around the O VII and O VIII emission lines (left vertical axis). Bottom panel: polarization intensity P along the same paths (S-PASS). The broad central peak matches the position of loop XII along the paths.
Current usage metrics show cumulative count of Article Views (full-text article views including HTML views, PDF and ePub downloads, according to the available data) and Abstracts Views on Vision4Press platform.
Data correspond to usage on the plateform after 2015. The current usage metrics is available 48-96 hours after online publication and is updated daily on week days.
Initial download of the metrics may take a while.