Fig. 6.

Download original image
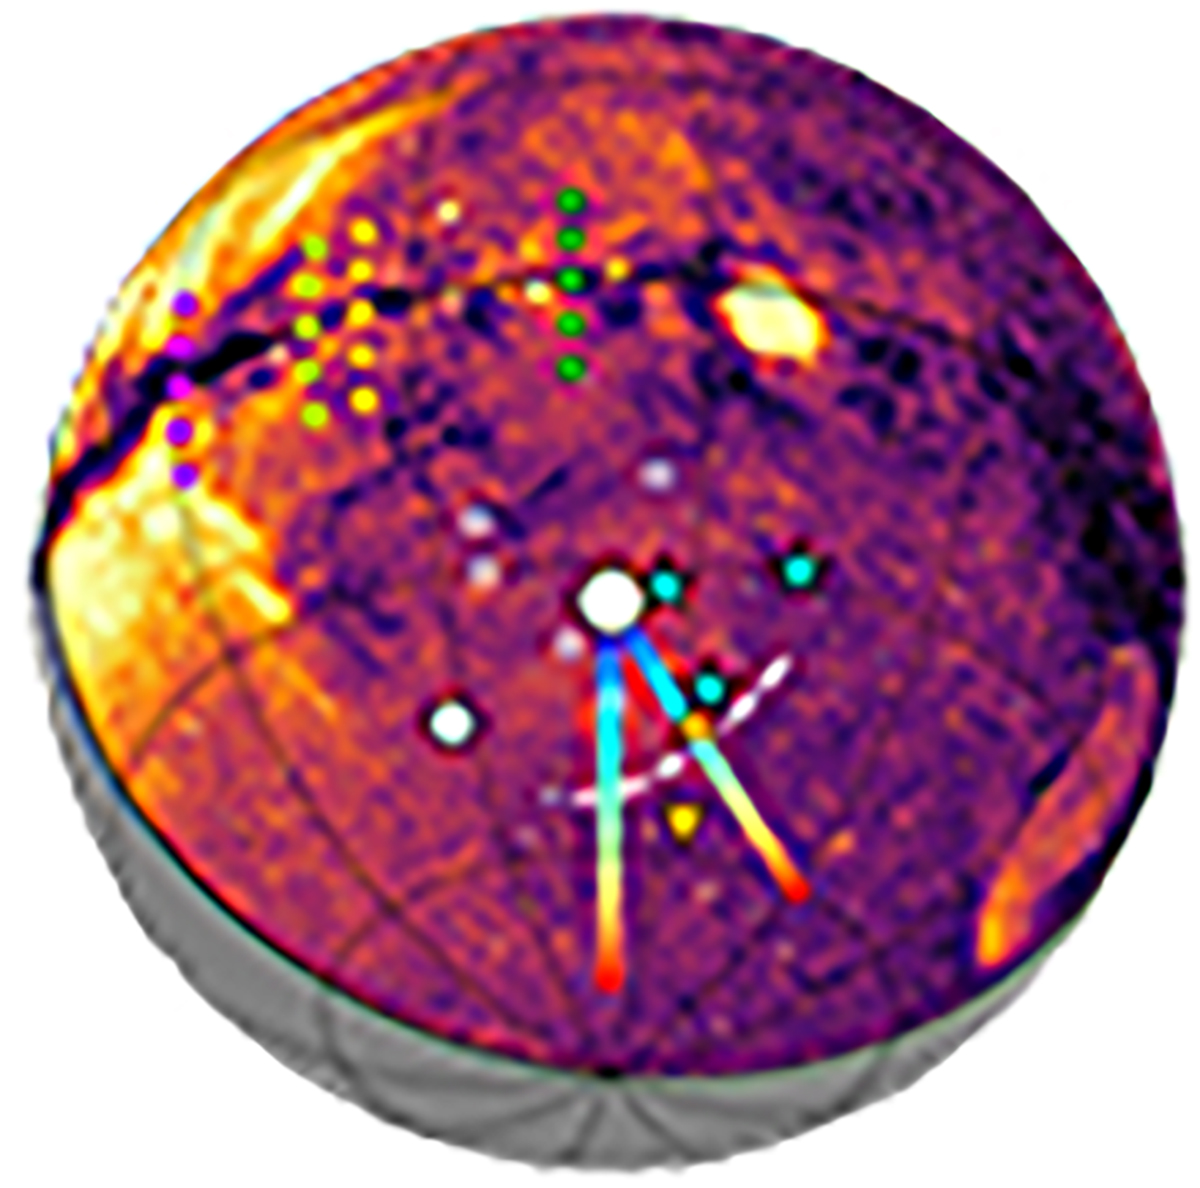
Chart map of the sources and features used and discussed in this work. The map is the same as Fig. 1. The dotted lines perpendicular to the Galactic disk and centered at b = 0 show directions tangential to the closest spiral arms of the Milky Way. By increasing l (i.e., right to left), they represent the Carina (green dots, l = 284 deg), Norma (orange dots, l = 306 deg), Centaurus (yellow dots, l = 312 deg), and Perseus (purple dots, l = 229 deg) arms. The large white dots represent the positions of the SMC and LMC. The empty white squares show the LoS characterized by high absorption, shown in Fig. 8. The cyan stars show the positions of the three bright X-ray sources with a detected O VII absorption line at z = 0: PKS 0558-504, LMC X-3, and 1H 0419-577, listed by decreasing latitude. The dashed white line shows the position of radio loop XII. The rainbow lines show the data we used to build the profiles and correlations in Figs. 9 and 11. The orange triangles show the positions of the on-source (upward) and background (downward) diffuse emission spectra shown in Fig. 10.
Current usage metrics show cumulative count of Article Views (full-text article views including HTML views, PDF and ePub downloads, according to the available data) and Abstracts Views on Vision4Press platform.
Data correspond to usage on the plateform after 2015. The current usage metrics is available 48-96 hours after online publication and is updated daily on week days.
Initial download of the metrics may take a while.


