Open Access
Fig. 4.
Download original image
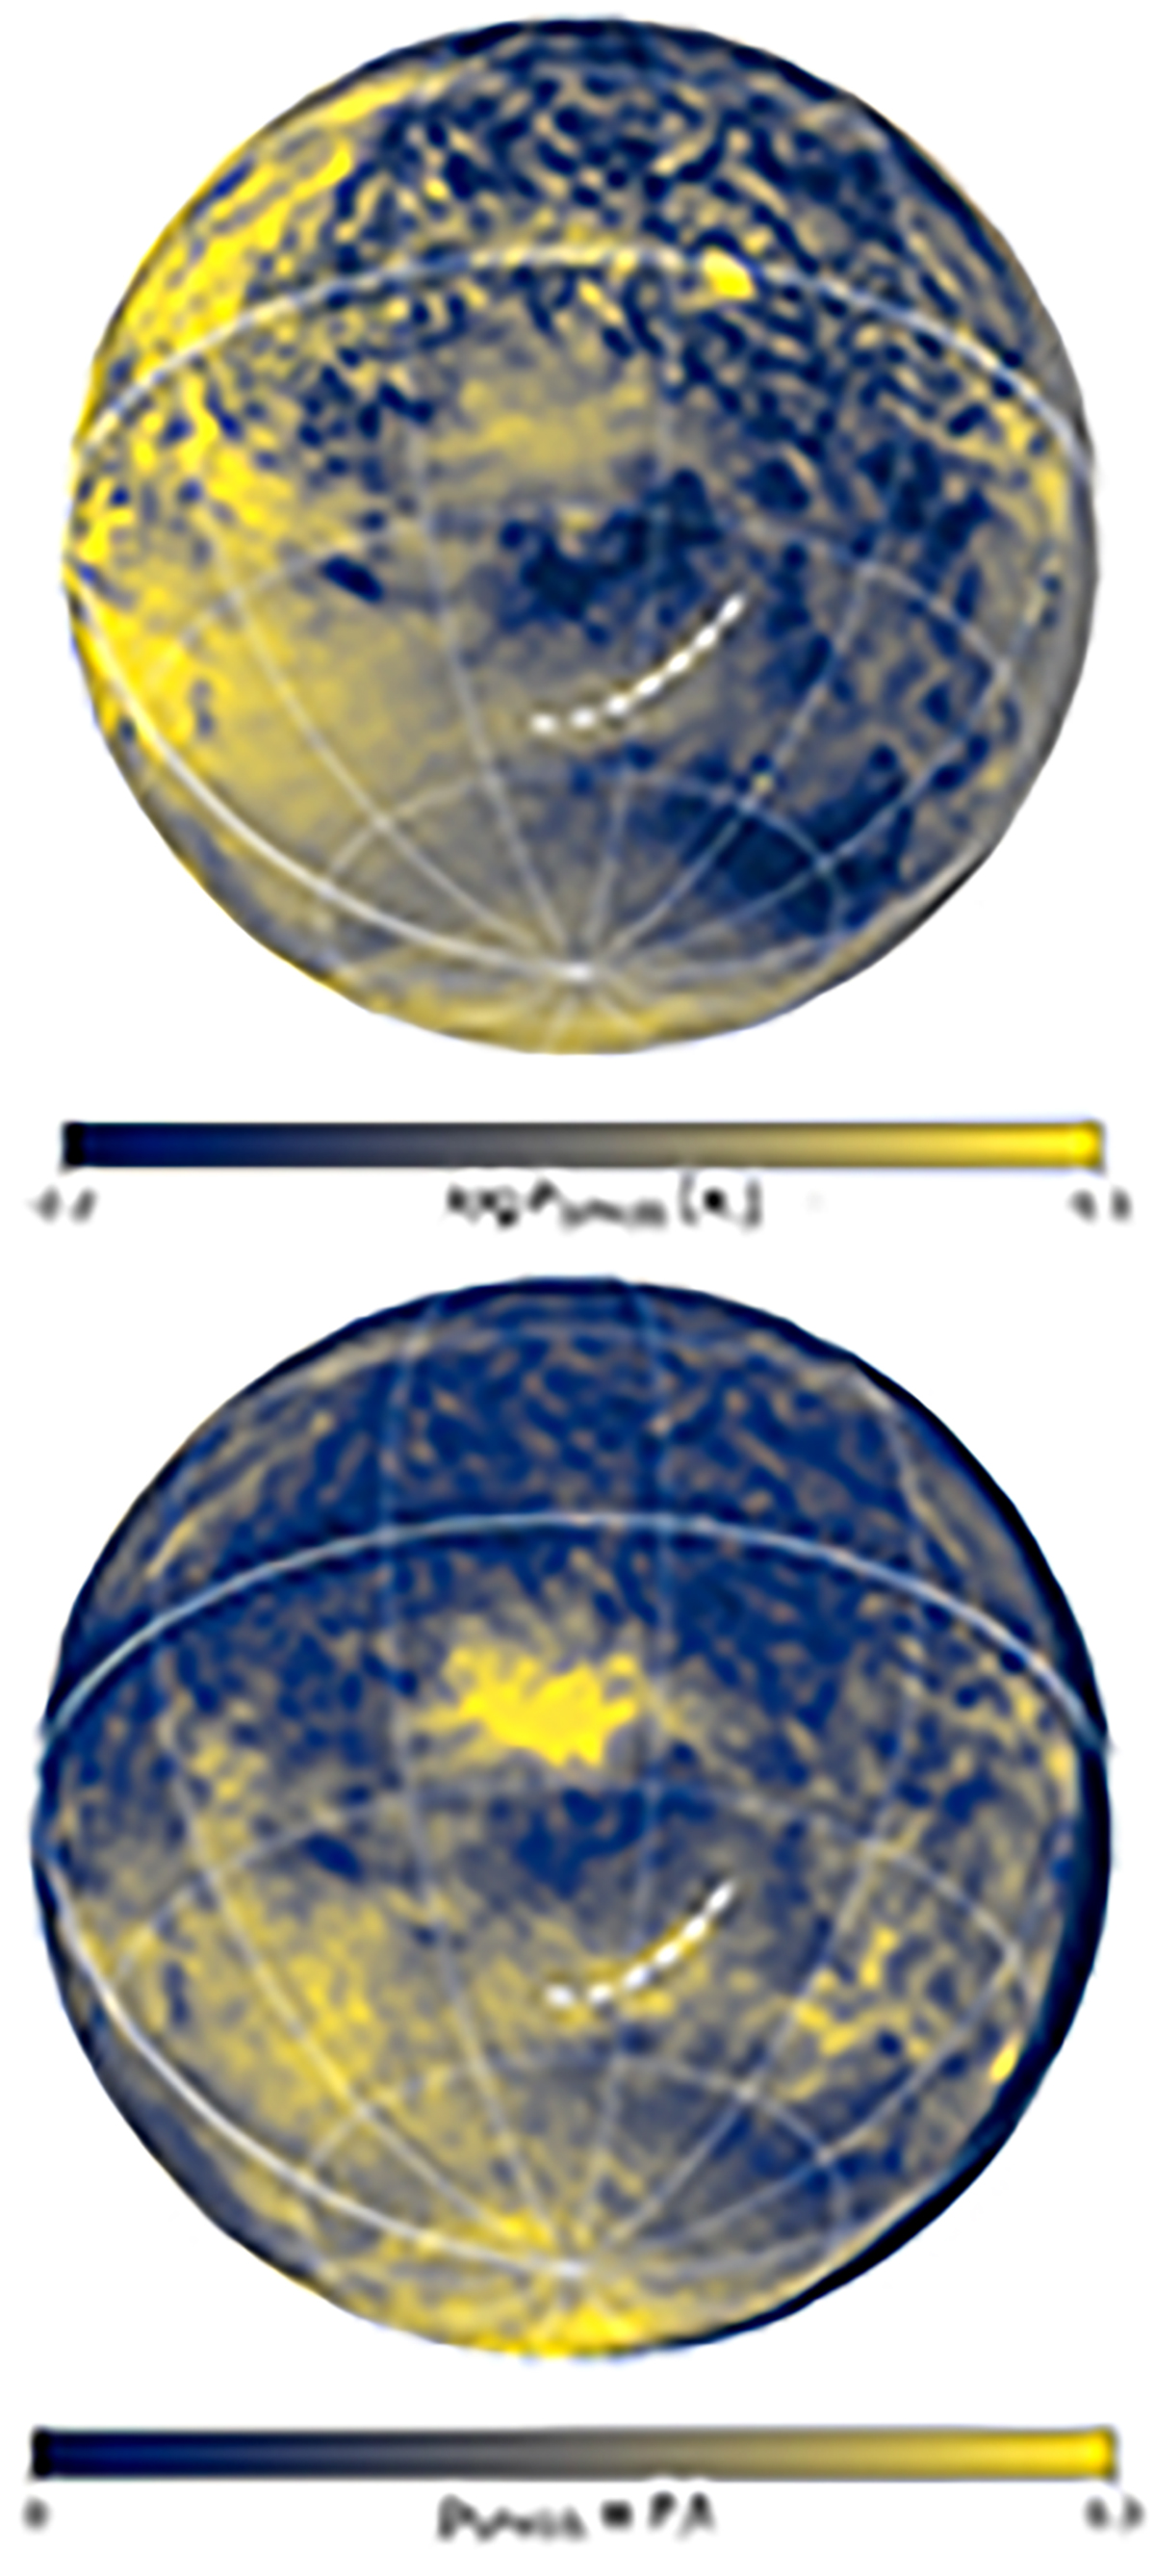
S-PASS 2.3 GHz radio polarization maps (Carretti et al. 2019). The dashed white line represents the location of polarized radio loop XII as originally defined by Vidal et al. (2015). Upper panel: linear polarization P. Lower panel: fractional polarization p ≡ P/I.
Current usage metrics show cumulative count of Article Views (full-text article views including HTML views, PDF and ePub downloads, according to the available data) and Abstracts Views on Vision4Press platform.
Data correspond to usage on the plateform after 2015. The current usage metrics is available 48-96 hours after online publication and is updated daily on week days.
Initial download of the metrics may take a while.