Fig. 3.
Download original image
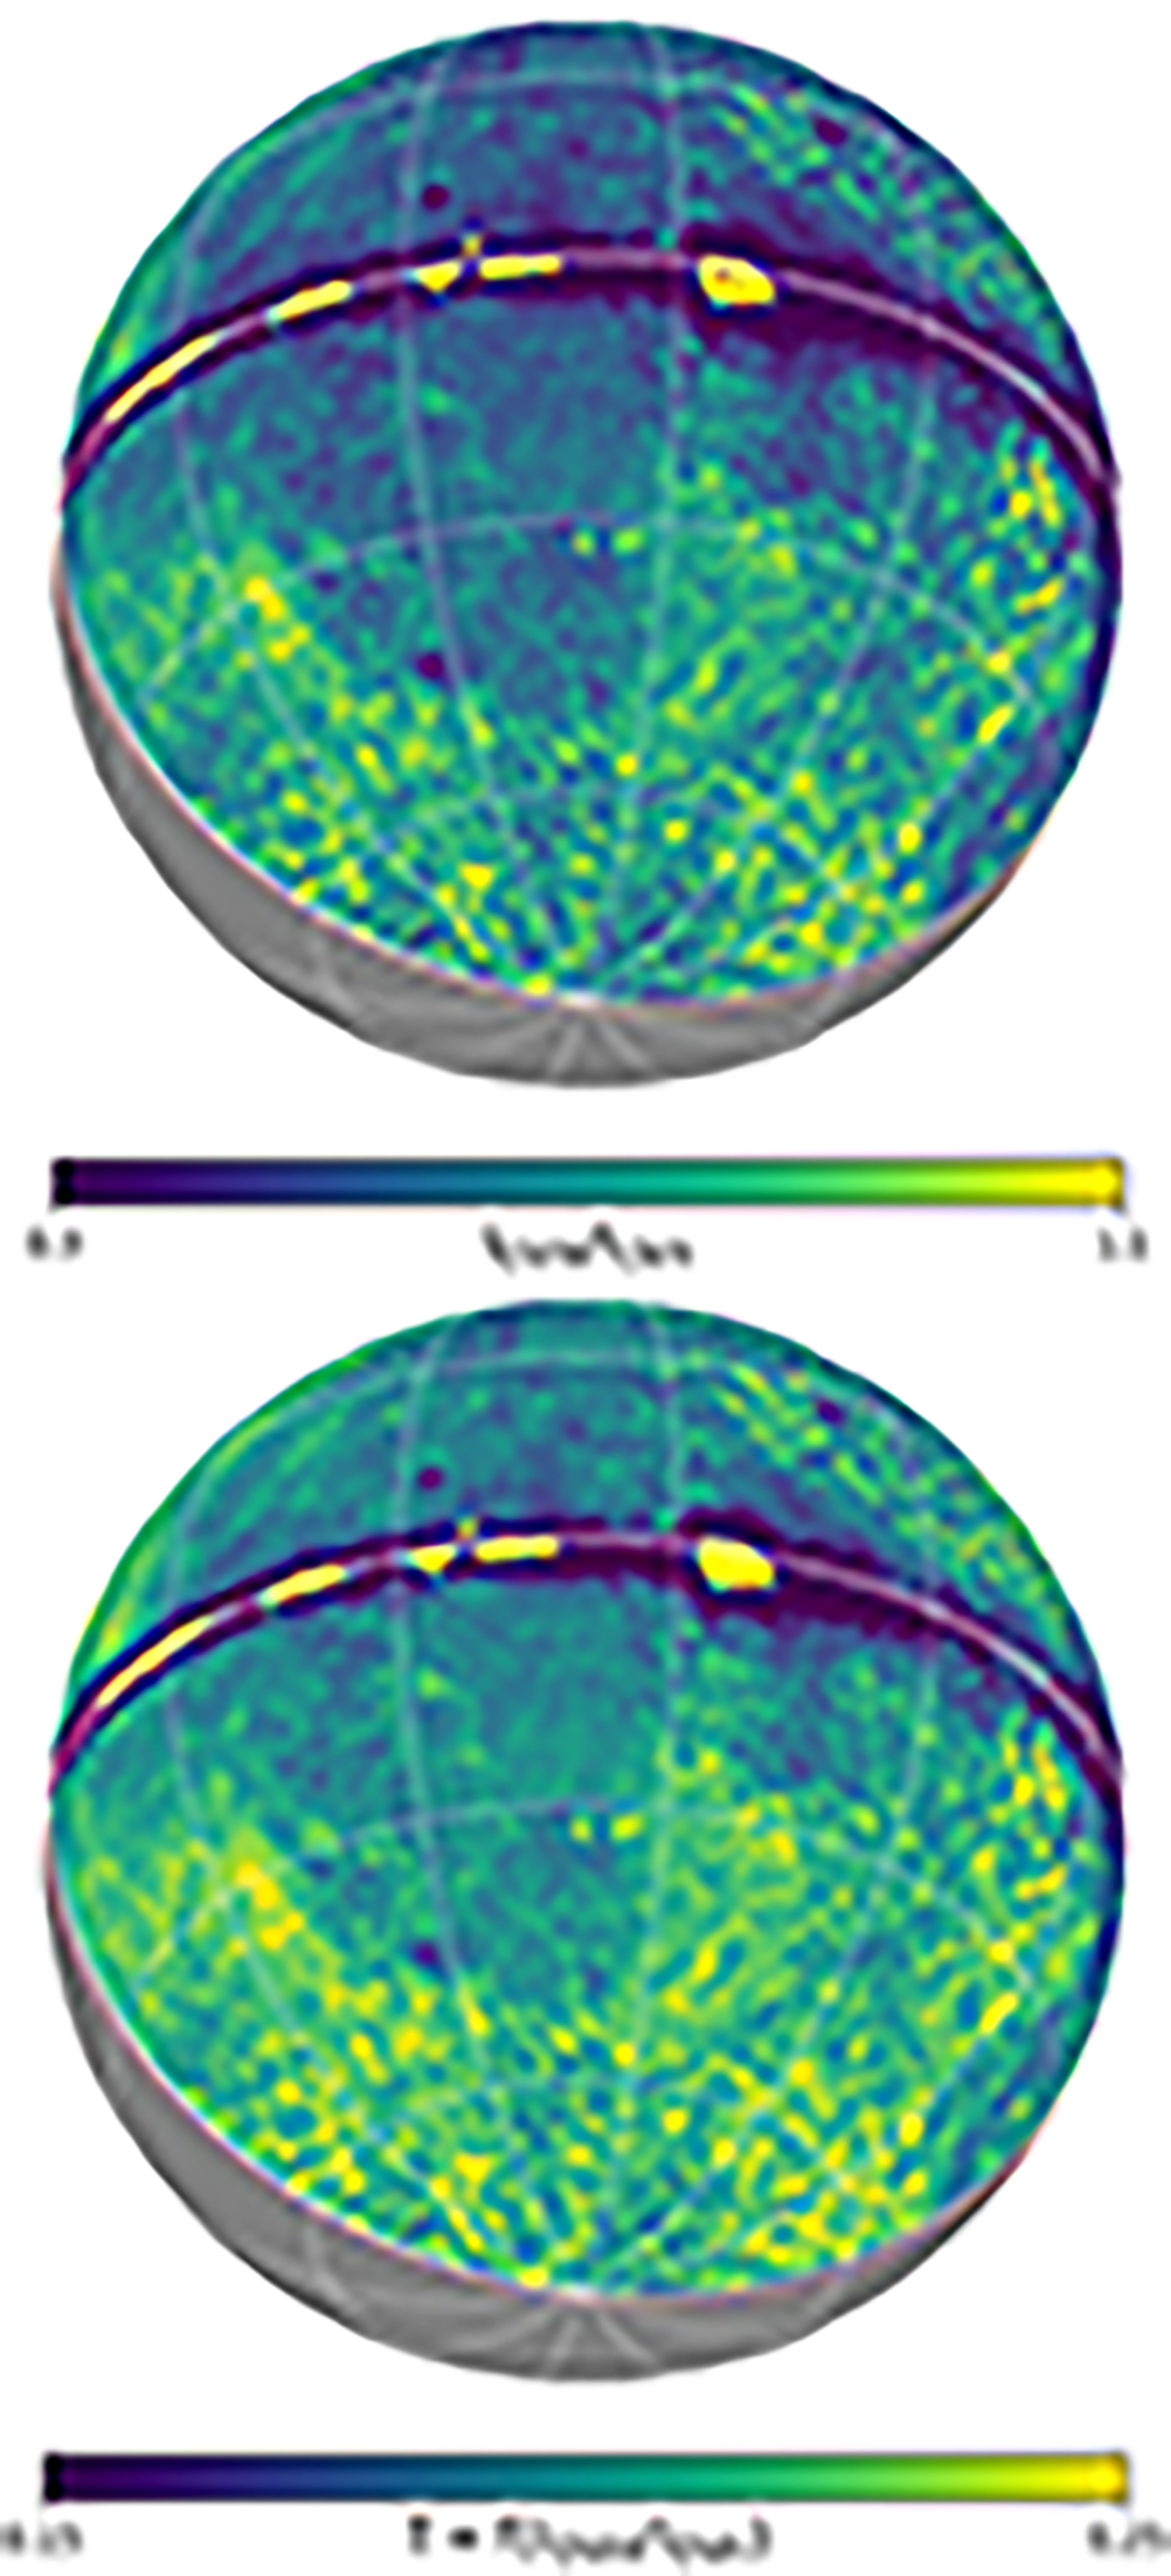
O VIII/O VII temperature proxy maps. Contributions from the local hot bubble foreground, the instrumental background, the cosmic X-ray background, and the foreground absorption were removed from the maps before we computed the ratio (see the text and Zheng et al. 2024a for further details). Lower panel: ratio of the narrow-band images centered on the O VIII and O VII emission lines. Upper panel: corresponding temperature under the assumption that the narrow-band energy ranges are dominated by O VII and O VIII lines, produced by collisionally ionized plasma.
Current usage metrics show cumulative count of Article Views (full-text article views including HTML views, PDF and ePub downloads, according to the available data) and Abstracts Views on Vision4Press platform.
Data correspond to usage on the plateform after 2015. The current usage metrics is available 48-96 hours after online publication and is updated daily on week days.
Initial download of the metrics may take a while.