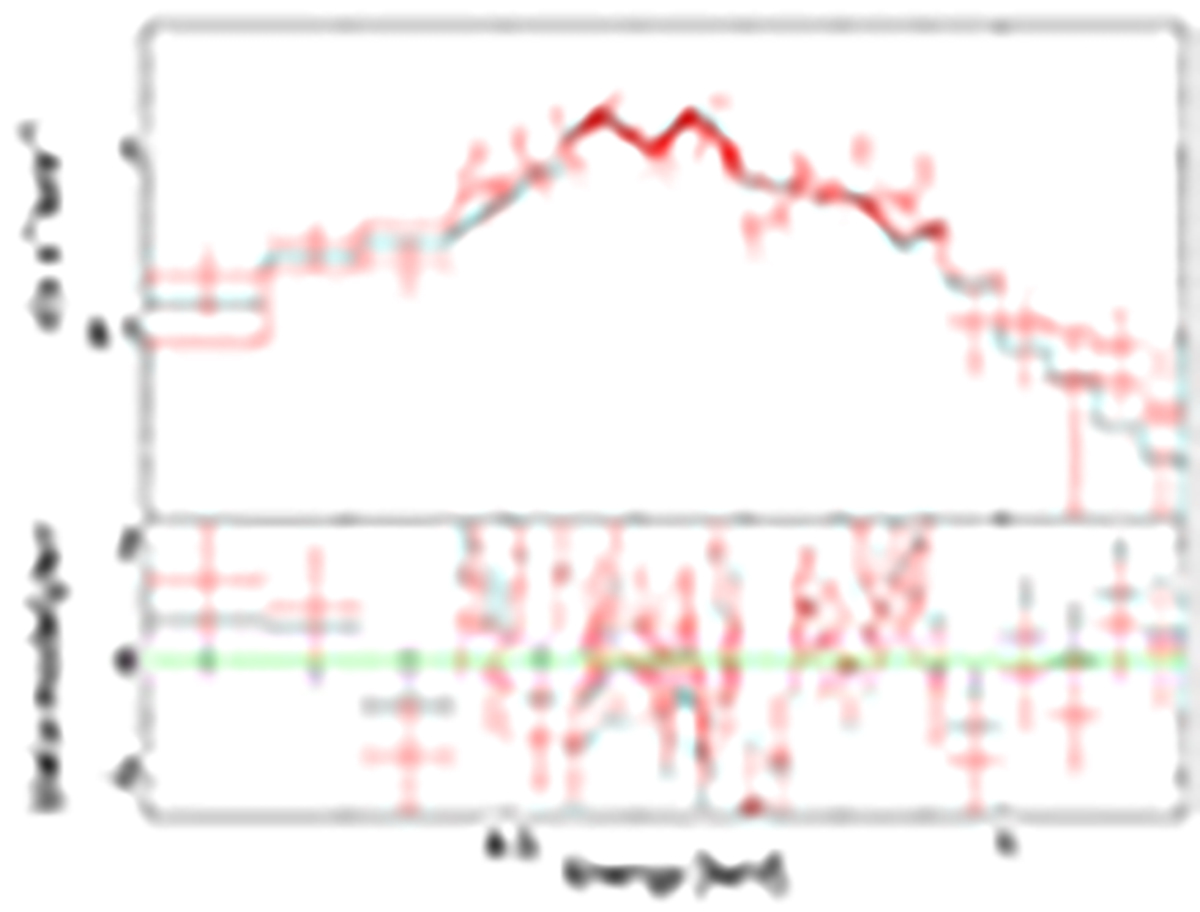
Fig. 10.
Download original image
0.3–1.2 keV spectrum of the excess emission at the position of the bright arc. The spectrum from a background region from outside the Goat Horn complex was subtracted from the data. The on- and off-source (i.e., background) regions are indicated by the upward and downward orange triangles in Fig. 6, respectively. The black and red lines show the best fits for different assumptions on the metal abundance of the hot plasma (Z = Z⊙ and Z = 0.1 Z⊙, respectively).
Current usage metrics show cumulative count of Article Views (full-text article views including HTML views, PDF and ePub downloads, according to the available data) and Abstracts Views on Vision4Press platform.
Data correspond to usage on the plateform after 2015. The current usage metrics is available 48-96 hours after online publication and is updated daily on week days.
Initial download of the metrics may take a while.