Fig. 1.
Download original image
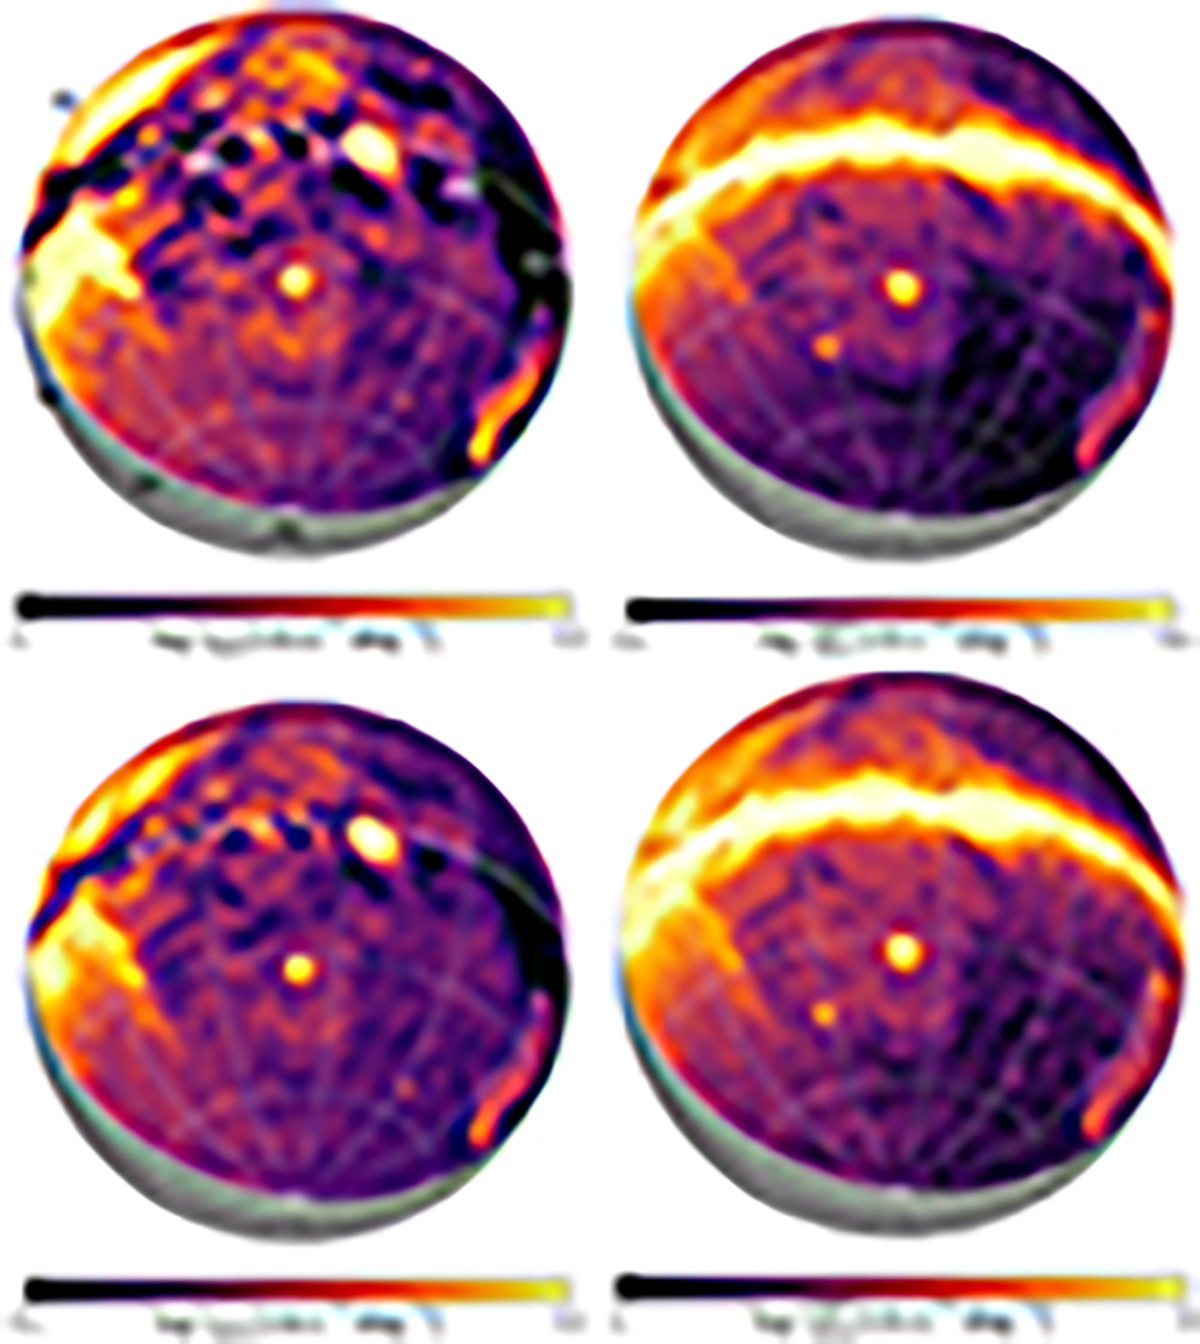
O VII and O VIII narrow-band eRASS1 maps. The images are centered at the LMC coordinates (l, b) = (280, −33.7) deg. All the maps presented in this work use the same projection. The solid white line represents the great circles b = 0 deg and l = 0 deg. The dotted white lines are separated by Δl = 30 deg in longitude and Δb = 30 deg in latitude. Left column: O VII (top) and O VIII (bottom) eRASS1 maps (Locatelli et al. 2024; Zheng et al. 2024a). Right column: deabsorbed intensity of the warm-hot CGM component of the Milky Way, extracted from the O VII (top) and O VIII (bottom) eRASS1 maps (i.e., left column). We refer to Locatelli et al. (2024) for details of the CGM intensity retrieval and of the deabsorption method.
Current usage metrics show cumulative count of Article Views (full-text article views including HTML views, PDF and ePub downloads, according to the available data) and Abstracts Views on Vision4Press platform.
Data correspond to usage on the plateform after 2015. The current usage metrics is available 48-96 hours after online publication and is updated daily on week days.
Initial download of the metrics may take a while.