| Issue |
A&A
Volume 688, August 2024
|
|
|---|---|---|
| Article Number | A100 | |
| Number of page(s) | 20 | |
| Section | Numerical methods and codes | |
| DOI | https://doi.org/10.1051/0004-6361/202449325 | |
| Published online | 08 August 2024 | |
Swarm intelligence for full Stokes dynamic imaging reconstruction of interferometric data
1
Departament d’Astronomia i Astrofísica, Universitat de València,
C. Dr. Moliner 50,
46100 Burjassot,
València,
Spain
e-mail: This email address is being protected from spambots. You need JavaScript enabled to view it.
2
Observatori Astronòmic, Universitat de València,
Parc Científic, C. Catedràtico José Beltrán 2,
46980
Paterna,
València,
Spain
3
Departament de Matemàtiques i Informàtica, Universitat de les Illes Balears,
07071
Palma de Mallorca,
Spain
4
Max-Planck-Institut für Radioastronomie,
Auf dem Hügel 69,
53121
Bonn (Endenich),
Germany
e-mail: This email address is being protected from spambots. You need JavaScript enabled to view it.
5
Jansky Fellow of National Radio Astronomy Observatory,
1011 Lopezville Rd,
Socorro,
NM
87801,
USA
Received:
23
January
2024
Accepted:
2
May
2024
Abstract
Context. In very long baseline interferometry (VLBI), the combination of multiple antennas permits the synthesis of a virtual telescope with a larger diameter and consequently higher resolution than the individual antennas. However, due to the sparse nature of the array, recovering an image from the observed data is a challenging ill-posed inverse problem.
Aims. The VLBI community is interested in not only recovering an image in total intensity from interferometric data, but also in obtaining results in the polarimetric and the temporal domain. Only a few algorithms are able to work in all these domains simultaneously. In particular, the algorithms based on optimization that consider various penalty terms specific to static total intensity imaging, time-variability and polarimetry are restricted to grids in the domain of the objective function. In this work we present a novel algorithm, multiobjective particle swarm optimization (MO-PSO), that is able to recover the optimal weights without any space-gridding, and to obtain the marginal contribution of each of the playing terms.
Methods. To this end, we utilized multiobjective optimization together with particle swarm metaheuristics. We let the swarm of weights converge to the best position.
Results. We evaluate our algorithm with synthetic data sets that are representative for the main science targets and instrumental configuration of the Event Horizon Telescope Collaboration (EHTC) and its planned successors. We successfully recover the polarimetric, static, and time-dynamic signature of the ground truth movie' even with relative sparsity, and a set of realistic data corruptions.
Conclusions. We have built a novel, fast, hyperparameter space gridding-free algorithm that successfully recovers static and dynamic polarimetric reconstructions. Compared to regularized maximum likelihood (RML) methods, it avoids the need for parameter surveys, and it is not limited to the number of pixels, unlike recently proposed multiobjective imaging algorithms. Hence, this technique is a novel useful alternative tool to characterize full Stokes time-(in)dependent signatures in a VLBI data set robustly with a minimal set of user-based choices.
Key words: methods: numerical / techniques: high angular resolution / techniques: image processing / techniques: interferometric
Both first authors have contributed equally to this work.
© The Authors 2024
 Open Access article, published by EDP Sciences, under the terms of the Creative Commons Attribution License (https://creativecommons.org/licenses/by/4.0), which permits unrestricted use, distribution, and reproduction in any medium, provided the original work is properly cited.
This article is published in open access under the Subscribe to Open model. This email address is being protected from spambots. You need JavaScript enabled to view it. to support open access publication.
1 Introduction
Very long baseline interferometry (VLBI) utilizes an array of multiple antennas to achieve unparalleled astronomical resolutions. Within this array, each antenna concurrently observes a celestial source, following the procedure outlined in the Zernike-van Cittert theorem (Thompson et al. 2017). The correlated signals from antenna pairs, in accordance with this theorem, approximate the Fourier transform of the true brightness distribution of the sky. The baseline distance between antennas on the celestial plane determines the specific Fourier frequency.
In an ideal scenario, a fully sampled Fourier domain (u, v plane) permits the retrieval of the original image via a simple inverse Fourier transform. Practical limitations, for example a limited number of antennas, restricted observing time, noise, and instrumental effects, lead to sparse Fourier coefficient measurements. This subset, denoted u, v-coverage, represents observed spatial Fourier frequencies. The above corruptions render the image reconstruction problem ill-posed.
Global VLBI, especially at millimeter wavelengths, introduces additional hurdles, namely a smaller number of antennas, imprecise visibility calibration, and lower signal-to-noise ratios compared to longer wavelength arrays. Consequently, the reconstruction problem lacks strong constraints, displaying nonconvex and possibly multimodal traits due to missing data. Successful imaging hinges on incorporating robust prior information.
Traditionally, CLEAN and its variations (Högbom 1974; Clark 1980; Bhatnagar & Cornwell 2004; Cornwell 2008; Rau & Cornwell 2011; Offringa et al. 2014) were the go-to methods for imaging. However, recent years have witnessed the emergence of new imaging algorithms for global VLBI data tailored to the needs of the Event Horizon Telescope (EHT). These additional methods fall mainly into four categories: super-resolving CLEAN variants (Müller & Lobanov 2023b), Bayesian methods (Arras et al. 2022; Broderick et al. 2020b; Tiede 2022), regularized maximum likelihood (RML) methods (Chael et al. 2016, 2018; Akiyama et al. 2017b,a; Müller & Lobanov 2022), and multiobjective optimization techniques such as Multiobjective Evolutionary Algorithm by Decomposition, or MOEA/D (Müller et al. 2023; Mus et al. 2024, Paper I and II hereafter).
Any of these algorithmic approaches has multiple benefits and disadvantages. In this manuscript we describe the design of a novel imaging algorithm, multiobjective particle swarm optimization (MO-PSO), that combines the speed and accuracy of RML techniques with the high degree of automatization (i.e., a small number of hyperparameters) and global exploration of the objective landscape inherent to MOEA/D (Zhang & Li 2007; Paper I; Paper II). To this end, we combined a particle swarm optimization algorithm in a multiobjective setting with gradient-based convex optimizations in a forward-modeling (RML) framework.
Compared to RML algorithms, MO-PSO models the sample of nondominated locally optimal solutions identified by Pareto optimality, similar to parameter surveys common for RML methods. It selects the objectively best image in an unsupervised automatized way. MO-PSO determines optimal weight combinations without a grid search by solving a convex problem (and thus a unique solution) aligning its complexity with standard RML methods, and orders of magnitudes faster than parameter survey strategies. As a byproduct, MO-PSO allows the characterization of images based on each regularizer’s value.
Compared to multiobjective optimization algorithms (i.e., MOEA/D), MO-PSO solves multiple numerical limitations: 1) a discretization of the weighting space is needed for MOEA/D, 2) an ad hoc rescaling has to be set to improve the numerical genetic operations performance, and 3) its computational complexity increases with denser meshes and the addition of new functionals (due to the exploration of a higher dimensional space) in MOEA/D. These limitations are mainly caused by the evolutionary optimization strategy inherent to MOEA/D, which leads to suboptimal numerical scaling. By replacing the genetic minimization with fast inner RML imaging iterations, MO-PSO overcomes these limitations.
Moreover, MO-PSO combines these advantages without casting the algorithmic framework into a less flexible setting. Thus, it is rather straightforward to extend the algorithm to full polarimetry, dynamic reconstructions, and finally the reconstruction of polarimetric movies following the strategy described in Paper II. The capability to recover polarimetric movies in a self-consistent forward-modeling framework is a unique capability shared by only few algorithms (Müller & Lobanov 2023a; Mus et al. 2024). In this manuscript we discuss the utilization of MO-PSO for polarimetric movie reconstructions as well, and demonstrate its performance in synthetic data. This work offers a swift, low-complexity, self-calibration-independent, and unsupervised alternative, working in full Stokes static and time dynamic reconstructions within a unified framework, and combining and advancing several of the advantages and capabilities of recently proposed imaging algorithms.
We outline the basic concept of the algorithm in detail, but restrict the demonstration of the performance of MO-PSO to a variety of exemplary outstanding studies, such as the reconstruction of real 2017 EHT data and the reconstruction of polarimetric and dynamic synthetic EHT and EHT+ngEHT data. More examples can be found in the git specified in Sect. 11.
2 VLBI measurements and polarimetry
In this section, we present a general overview of VLBI full Stokes measurements. The section presents standard radio interferometry data products and is based on Sect. 2 in Paper II.
The correlated signal of an antenna pair, denoted as the visibility 𝒱(u, v), is described by the van Cittert-Zernike theorem (Thompson et al. 2017):
 (1)
(1)
This equation states that the true sky brightness distribution, represented by I(l, m), and the observed visibilities form a Fourier pair. The coordinates (u, v) are defined by the baselines that separate each antenna pair relative to the sky plane. However, it is important to note that, in practice, not all Fourier frequencies are measured, resulting in a sparse coverage in the (u, v)-plane, and particularly sparse in VLBI. This sparsity makes the task of imaging, which involves recovering the sky brightness distribution from the observed visibilities, an ill-posed inverse problem since the codomain is sparsely sampled. Furthermore, the visibilities are subject to calibration issues and thermal noise. To address these challenges, we must correct for calibration effects. Direction-independent calibration effects are incorporated into station-based gain factors, denoted as gi. The measured visibilities for a given time t observed along one antenna pair, i,j, are given by
 (2)
(2)
with station-based gains gi, gj and a baseline-dependent random noise term N (i, j, t).
The light’s polarized fraction recorded at each antenna is split into various polarizations by polarization filters (orthogonal linear, or right- or left-handed circular), contributing to four Stokes parameters: I, Q, U, and V. These parameters satisfy the inequality
 (3)
(3)
signifying that the total intensity of polarized and unpolarized emission always surpasses the polarized intensity. Similar to Stokes I imaging, Stokes visibilities for different parameters are identified as (Thompson et al. 2017)
 (4)
(4)
 (5)
(5)
 (6)
(6)
 (7)
(7)
where 𝓕 is the Fourier transform functional. The Stokes visibilities are considered the observables for the remainder of this manuscript. Polarimetry is also affected by station-based gains and thermal noise across all bands, alongside dealing with leakages and feed rotations. Particularly, the leakage between the perpendicular polarization filters introduces cross-terms (Thompson et al. 2017).
3 Multiobjective optimization
Multiobjective optimization is a branch of mathematics that deals with the solution of optimizing a set of (potentially contradicting) objective functions at the same time (see, e.g., Pardalos et al. 2017). Given a vector functional, F:= (ƒ1,…,ƒn), the multiobjective optimization problem (MOP) is
(MOP formulation)
 (MOP)
(MOP)
We define optimality in such a multiobjective setting by Pareto optimality. A solution is called Pareto optimal if the further minimization along one objective functional fi automatically has to worsen the scoring in another one (Pardalos et al. 2017). The set of all Pareto optimal solutions is called the Pareto front.
Several strategies exist for solving this kind of problem. In particular, Paper I and Paper II presented a technique using the MOEA/D (Zhang & Li 2007) for obtaining static and dynamic Stokes I and polarimetric reconstructions of interferometric data.
In this work, we scalarize the vector function F in the form of the scalarized MOP formulation:
(Scalarized MOP formulation)
 (MOP-Scalarized)
We can illustrate the conceptual idea behind this scalariza-tion. If the various objectives are contradicting each other, the various objectives promote different parts of the solution space. In this way, we can survey local minima by different configurations of the λi vectors (i.e., by different scalarizations). The sample of solutions to each of these scalarized problems approximates the Pareto front as long as the (normalized) weighting arrays λi span the complete range of possible configurations.
A particular solution vector of the MOP is the ideal vector, formed by
 (8)
(8)
The ideal determines a lower bound of the Pareto front. The distance of one Pareto optimal solution to the ideal defines a metric that can be used as a selection criterion. It has been demonstrated in Paper I and Paper II that the Pareto optimal solution that is closest to the ideal point represents the objectively best reconstruction within the Pareto front for VLBI (static, dynamic, and polarimetric) imaging problems.
4 Particle swarm optimization
Particle swarm optimization (PSO) is a population-based stochastic optimization algorithm used to find the optimal solution to a problem by iteratively improving a swarm of candidate solutions (particles) according to a specified fitness function. The fundamental basis of the socio-cognitive learning process within PSO lies in a particle’s individual experience and its observation of the most successful particle.
A basic PSO algorithm (see Du & Swamy 2016, for an extensive explanation of this algorithm and its variants) could be described as follows. In an optimization scenario with n variables, a swarm of Np particles is established, each assigned a random n-dimensional position representing a potential solution. Every particle possesses its trajectory (the position wi and velocity vi) moving in the search space via sequential updates.
The particles of the swarm adapt their trajectories by referencing the best positions they or others have previously visited. All particles possess fitness values evaluated by an optimization-focused fitness function. The particles navigate the solution space by following the currently optimal particles. The algorithm initiates a set of particles with random positions and proceeds to explore optima through successive generations.
In each iteration, particles are updated by considering two significant values: their individual best, indicated as  for i = 1,…, Np, representing their personal best solution achieved thus far, and the global best, denoted wg, signifying the best value obtained by any particle within the population.
At iteration t + 1, the swarm undergoes an update by
![Mathematical equation: ${\upsilon _i}(t + 1) = k{\upsilon _i}(t) + {c_1}{r_1}\left[ {\omega _i^*(t) - {\omega _i}(t)} \right] + {c_2}{r_2}\left[ {{\omega ^g}(t) - {\omega _i}(t)} \right].$](/articles/aa/full_html/2024/08/aa49325-24/aa49325-24-eq12.png) (9)
(9)
 (10)
(10)
PSO finds a global solution by adapting the velocity vector of each particle according to its personal best position (cognition aspect, c1) and the global best position (social aspect, c2) of particles in the entire swarm at each iteration. An inertia k can be imposed to accelerate the convergence, and r1, r2 are two random numbers drawn from 𝒩 (0, 1).
5 Modeling the problem
We search for the Pareto optimal solution that is closest to the ideal point following the strategy presented in Paper I and Paper II. Hence, we minimize the functional
 (11)
(11)
where z = (z1, z2,…) is the ideal point, and xp is the solution to the scalarized problem (MOP-Scalarized) with respect to the weight vector λ = wp. We aim to optimize for the best weight vectors wp by PSO (where every particle is a vector of weights wp), and the best image xp follows as a byproduct, which is evaluated using the limited memory Broyden-Fletcher-Goldfarb–Shanno (BFGS) algorithm (Byrd et al. 1995).
The method is described in Algorithm 1. First, we initialize the PSO algorithm (i.e., the initial positions and the velocities of the particles). We can pre-compute ideal points zi associated with the objectives.
Second, we initialize a swarm of m particles,  . Each particle is a vector in ℝn and is a combination of λi (i.e., the swarm is an array of weights that move toward the optimal weight combination). We iteratively solve Problem (MOP) defining the goodness of the particle via the fitness function J. In this way, we make the swarm (or the weighting vectors) move toward the objective closest to the ideal vector. The swarm is moved by updating the velocity and position, as described by Eqs. (9) and (10). The movement of a single particle is accepted once the fitness function J improves. We note that for this evaluation we have to find the optimal solution to problem (MOP-Scalarized) which is a second, internal optimization problem.
Finally, once the swarm has converged, the swarm of particles wp and their corresponding evaluations Jp constitutes a sample of local minima based on the geometry of the Pareto front. To find the global minimum, we select the particle with the smallest distance to the ideal point. We evaluate Problem (MOP-Scalarized) with the global best weight combination w*. The result is the primary product of the MO-PSO algorithm: A good approximation to the on-sky intensity distribution.
The external minimization is done by PSO, the internal minimization (which is equivalent to the classical RML imaging problem) by BFGS optimization. In this sense MO-PSO combines multiobjective evolutionary algorithms with RML imaging.
6 Functionals
In this section, we present the different functionals used in increasing (problem) complexity. We first start by solving the total intensity problem. We then model the polarimetry, followed by dynamic imaging and conclude by the polarimetric dynamic problem.
Require: The set of objective-players of the MOP to be solved
(f1,…, fn)
Require: Bounds on RML weights: blo, bup
Create a swarm of particles  , each one being a vector of ℝn, with positions drawn from a uniform distribution s ~ U(blo, Uup) and velocities following a Normal distribution v ~𝒩 (0, l)1
Find ideal point:  for i = 1,2,…, n
while termination criterion is not met do
for each particle, wp, of the swarm do
Update particle velocities vp following Eq. (9)
Update positions  via Eq. (10)

Fp ← ( f1(sp), f2(sp), …, fn(sp))

if  then
then


end if
end for
end while
Select the wp with lower value of Jp, denoted by w*
Solve PSOimage ← arg minx{Σi w* fi (x)}
6.1 Totalintensity
Reconstructing static total intensity images is a well-studied problem. In the context of interferometry using forward-modeling, there are two main families (see Mus 2023, for a more extended review): 1) backward-modeling (Högbom 1974; Cornwell 2008; Müller & Lobanov 2023b) and forward-modeling (Honma et al. 2014; Chael et al. 2016, 2018; Akiyama et al. 2017b,a; Arras et al. 2019, 2021; Event Horizon Telescope Collaboration 2019; Broderick et al. 2020b; Müller & Lobanov 2022; Tiede 2022, for instance). Forward-modeling algorithms group several families. For this work, we focus on RML and mul-tiobjective formulations (see Paper I and Paper II). In both cases, the methods try to minimize a (set of) objective(s) including data fidelity terms that measure the fidelity of the guess solution to the observed data, and regularizers that impose conditions on the pixel brightness distribution of the image.
6.1.1 Data fidelity terms
Given the number of observed visibilities Nvis, visibilities of the recovered solution 𝒱i, and error Σi, the fit to the visibilities is given by
 (12)
(12)
and to the amplitudes by
 (13)
(13)
More complex relations, such as closures (terms independent of antenna corruptions; Thompson et al. 2017) can be modeled using
 (14)
(14)
and
 (15)
(15)
to fit phases (Ψ) and amplitudes (A), respectively.
6.1.2 Regularizers
Regularization terms measure the feasibility of the solution to fit the data with a model that is as simple as possible. The usual choices to include are
 (16)
(16)
 (17)
(17)
 (18)
(18)
 (19)
(19)
 (20)
(20)
 (21)
(21)
where M denotes the brightness distribution of a model image and f is the total flux (Akiyama et al. 2017b; Chael et al. 2018; Müller et al. 2023). In the standard formulation of these terms, they are added with corresponding weighting parameters α,ß, …,κ ∈ ℝ to create the full objective functional 𝓕:
 (22)
(22)
For this work we developed a novel approach, able to find the marginal contribution of each regularizer without performing any survey. To this end, we reconstructed an image in total intensity considering the seven objective functionals:
 (23)
(23)
 (24)
(24)
 (25)
(25)
 (26)
(26)
 (27)
(27)
 (28)
(28)
 (29)
(29)
For the remainder of this manuscript, we restrict ourselves to α = β = 0 (i.e., we study calibration-independent imaging only from the closure products). In this way, we made the Stokes / imaging independent of the self-calibration procedure, at the cost of an increased data sparsity (i.e., the number of statistically independent closure quantities is smaller than the number of statistically independent visibilities). However, it has been demonstrated in recent works that in the setting of the VLBI, closure quantities are constraining enough to retrieve the image structure in the presence of strong prior information (Chael et al. 2018; Müller & Lobanov 2022; Arras et al. 2022; Thyagarajan et al. 2023). Particularly, in Paper I we show that the degeneracies inherent to closure-only imaging are effectively into the Pareto front. This indicates that multiobjective evolution provides a reasonable framework to deal with closure-only imaging as used for the remainder of this manuscript.
6.2 Polarimetry
6.2.1 Data term
In the context of polarimetry, we incorporate a χ2-fit approach to evaluate the linear polarized visibilities, denoted as 𝒱Q and 𝒱U. This incorporation is made as an additional component in the form of a data term denoted by Spvis:
 (30)
(30)
Here 𝒱P = 𝒱Q + i𝒱U denotes the visibility of the complex linear polarization vector P = Q + iU, and VP and ΣP are the corresponding model visibilities and errors.
6.2.2 Regularizers
We use the same regularizer functionals appearing in Mus et al. (2024) and defined in Chael et al. (2016) and that have been proven to work (see, e.g., Event Horizon Telescope Collaboration 2021). In particular, we make use of the function-als known as Rms, Rhw, and Rptv, which we describe in more detail in the subsequent sections.
First, we use the conventional KL polarimetric entropy (Ponsonby 1973; Narayan & Nityananda 1986; Holdaway & Wardle 1988; Chael et al. 2016) of an image I with respect to a model Mi:
 (31)
(31)
 (32)
(32)
Here mi denotes the fraction of linear polarization in pixel i. Rhw favors images of N pixels with fractional polarization m of less than one. The second regularizer Rms is
 (33)
(33)
Finally, we utilize the polarimetric counterpart of the total variation regularizer (Chael et al. 2016)
 (34)
(34)
where P is the complex realization of the linear polarized emission (i.e., P = Q + iU). In conclusion, the resulting multiobjective problem consists of the single functionals:
 (35)
(35)
 (36)
(36)
 (37)
(37)
 (38)
(38)
6.3 Dynamics
Dynamics are modeled using the ngMEM functional (Mus et al. 2024; Mus & Martí-Vidal 2024). Here we present a brief formulation, and we refer to the bibliography for further details. We consider a time partition of the observation times into r keyframes. The visibilities of one frame are
![Mathematical equation: ${{\cal V}^l} = \{ {\cal V}\,\,{\rm{for}}\,\,t \in [{t_l} - \Delta {t_l}/2,{t_l} + \Delta {t_l}/2]\} ,l \in [1,r],$](/articles/aa/full_html/2024/08/aa49325-24/aa49325-24-eq51.png) (39)
(39)
where tl is the observing time, and ∆tl is a frame-dependent scalar that determines its duration. For each l, the associated data set 𝒱l produces an “image keyframe.” The model will have a total of r × N2 parameters (i.e., r images of N2 pixels each).
6.3.1 Data term
Now we naturally extend the data terms and penalty terms to a time series, for example by
 (40)
(40)
where p is a time series of images (i.e., a movie). We proceed analogously for all the other data terms and regularization terms.
6.3.2 Regularizer
In Paper II, we modeled the dynamical imaging problem by including the ƒngMEM functional. This regularizer, introduced in Mus (2023) and Mus & Martí-Vidal (2024) acts on a sequence of images  :
:

Here j, k ∈ {1,2,…, r} denotes the frame in the time series, µngMEM is a hyperparameter, and
 (41)
(41)
Here tj denotes the times of the associated keyframe j and σ and µngMEM are two a priori hyperparameters. While σ has a minor effect, µngMEM is the weight considered as a particle of our swarm. We refer to Mus et al. (2024) and Mus & Martí-Vidal (2024) for further details.
We can solve this problem of dynamic imaging (i.e., finding the set of image keyframes that optimally fit the data) by using the following formalism:
 (42)
(42)
 (43)
(43)
 (44)
(44)
 (45)
(45)
 (46)
(46)
 (47)
(47)
 (48)
(48)
 (49)
(49)
6.4 Dynamic polarimetry
To solve the dynamic polarimetric problem, one can adopt two strategies. The first strategy can be to emulate the procedure presented in Paper II for MOEA/D and Müller & Lobanov (2023a) for DoG-HiT, intended to avoid high-dimensional problems of the Pareto front. This strategy is split into several steps. First, we solve for the dynamics in total intensity as described in Sect. 6.3. We self-calibrate the data set and do the leakage calibration. Second, we calculate a static polarimetric image, as described in Sect. 6.2. Third, we cut the observation into keyframes and solve the polarimetric imaging at every keyframe independently using Algorithm 1, initializing the population with the final population of the static polarization step and assuming the Stokes I image from the time-dynamic exploration.
The second strategy could be add all polarimetric, time-dynamic, and static data terms together to the same multi-objective problem. While the problem formulation would be straightforward, and the numerical complexity acceptable, this strategy does not represent the strategy that will be applied in practice since a significant part of the forward is still missing as we do not include the leakage terms in the data terms. One way to circumvent this difficulty would be to use the properties of closure traces (Broderick et al. 2020a) directly for leakage-independent imaging. However, this approach comes with its own challenges, and is deferred to a consecutive work. For the remainder of this manuscript, we emulate the strategy presented in Paper II.
7 Comparing MO-PSO reconstruction philosophy with MOEA/D and single-objective philosophies
In this section we compare and remark on the differences between the well-known single-objective forward method, as the method presented in ehtim (Chael et al. 2016, 2018) or smili (Akiyama et al. 2017b,a), the multiobjective imaging reconstruction (Paper I and Paper II) and the method presented here.
In general, the novel approach of MO-PSO can be summarized as seeking the best hyperparameter combination, and then checking if its associated image is good. In other words, the main effort of this algorithm focuses on solving the convex weight problem, and the reconstruction is a byproduct.
7.1 MOEA/D
MOEA/D and MO-PSO share many similarities. They are both multiobjective evolutionary algorithms that have the same set of single objectives. They both utilize the concept of Pareto opti-mality to identify the best reconstructions, and are based on the same concept of finding the Pareto-optimal solution that is closest to the ideal. However, there are significant differences.
The MOEA/D formulation seeks the images that are the best compromises between the different regularizers and are closer to the model. It identifies these solutions by approximating the full Pareto front. MO-PSO also explores the Pareto front globally, but converges to the image with best possible weight combination without storing or representing the full front. We can nevertheless identify the robustness of solutions by MO-PSO due to its randomized evolution (see Sect. 10 for more details). While MOEA/D compares each regularizer with respect to the data terms, MO-PSO frees each regularizer and is able to compute a marginal distribution of each regularizer in this way. MOEA/D loses the marginal contribution of each regularizer, and returns the relative importance of the hyperparameters instead.
MOEA/D explores all weight combinations. The number of combinations is given by the size of the grid (and therefore the number of subproblems in which it is decomposed). In contrast, MO-PSO leaves the weights free and explores a continuous space rather than a gridded one2. A strategy of particles moving toward a global optimum is much faster than an evolutionary grid search. Therefore, MO-PSO is orders of magnitude faster than MOEA/D in searching for the Pareto-optimal solution closest to the ideal, and utilizes a significantly smaller number of evaluations of the single-objective minimization problem (MOP-Scalarized). This benefit is underlined by two specific updates to the imaging algorithm. We use a different evolutionary strategy (swarm intelligence instead of genetic operations), and solve the single-objective minimization problems (MOP-Scalarized) by fast gradient-based convex optimization algorithms rather the slower genetic evolution. In consequence, a single MO-PSO run in a data set with a similar number of data points, corruptions, and coverage as the EHT 2017 data can be finished on timescales of minutes on a medium-level notebook.
7.2 Single-objective
Standard RML methods focus on finding the best image by balancing regularization terms and data terms with manually predefined parameter combinations. Hence, they need to explore a set of hyperparameter combinations on synthetic data to find the best working combination. Then they evaluate the final reconstruction with these parameter combinations. This exercise has been done intensively within the EHT data analyses (Event Horizon Telescope Collaboration 2019, 2021, 2022). The EHT not only included realistic image structures as synthetic data, but also surveyed a larger number of geometric models and found a common parameter combination that worked across models. This proved crucial in establishing reliable bias-free images of the shadows of black holes.
However, this exploration is expensive and time consuming. In addition, it is limited in the parameter combinations that are explored, and does not encode relative or absolute information about their contribution. MO-PSO particularly differs and advances in two important ways from such a strategy.
First, we replace the grid-search technique inherent to parameter surveys by an evolutionary strategy based on swarm intelligence. MO-PSO needs a few number of iterations to arrive at a parameter combination that passes the top-set selection criterion defined in Event Horizon Telescope Collaboration (2019). It speeds up the data analysis significantly in this way. Moreover, while the parameter survey strategy was sufficient to establish a robust image in total intensity, the problem quickly becomes intractable once polarization and time-dynamics is included, due to the high number of parameter combinations that scale exponentially with the number of data terms. MO-PSO presents a better scaling since the number of iterations and number of particles only loosely depends on the number data terms, but more strongly on the complexity of the Pareto front and the number of their respective clusters (see the discussion of the clusters in the Pareto fronts in Paper I and Paper II).
Second, MO-PSO includes a strategy to find the best weighting combination self-consistently on the data itself and does not incorporate studies on synthetic data. This criterion, the weighting combination that minimizes the distance to the ideal point, also allows for the reconstruction of parameter combinations that are specific to each data set, and thus the classification of data sets by their respective regularizer response (see Sect. 10).
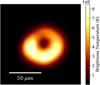 |
Fig. 1 Reconstruction of M87 on April 11, 2017, using PSO algorithm, with 25 particles. |
8 Verification on EHT data
To verify the performance of the algorithm in Stokes I, we show the reconstructions of M87* observed on April 11 during the 2017 EHT campaign (see Event Horizon Telescope Collaboration 2019), following the analysis done in Paper I. In the public repository (see Sect. 11) we provide the code to reconstruct other geometric forms.
Figure 1 shows the reconstructed M87* PSO image. We compared the reconstructed image with the one presented to the public by the EHT (Event Horizon Telescope Collaboration 2019) using the normal-cross correlation (or nxcorr) (see, e.g., Farah et al. 2022) which gives ~0.94. The algorithm was run using 50 iterations and 25 particles, and took ~10 min, in a computer of 12 cores, i7 10th generation.
The marginal contribution of the weights is ζ ~ 13.9%, θ ~ 6%, τ ~ 11.02%, η ~ 7.57%, є ~ 33.17%, κ ~ 16%. From these values, we can extract that the flux regularizers, l1, are crucial to obtain a good image.
In Sect. 10, we perform a statistical analysis of the marginal contribution of each weight in this M87* real data and in synthetic geometric models. We aim to generalize the conclusion here explained for each regularizer, and to constrain their range.
We discuss and present the performance of MO-PSO in recovering polarimetric signatures as part of the dynamic and polarimetric movie reconstruction that is discussed in the next section. However, as an additional demonstration case, we redid the geometric ring model tests that were performed in Paper II in Appendix B.
9 Verification on synthetic data in EHT+ngEHT array
We tested the capability to do dynamic polarimetry with a synthetic data set that is based on the third ngEHT Analysis challenges (Roelofs et al. 2023)3. The ground truth movie of Sgr A* is based on a model presented (Broderick et al. 2016) with a shearing hotspot (Tiede et al. 2020) inspired by the observations of GRAVITY Collaboration (2018). The respective uv-coverage for the whole observation is presented in Fig. 2 (black dots). We added thermal noise, but assumed a proper gain and leakage calibration. We note that since α = β = 0 is set as a configuration for this manuscript (compare Sect. 6), the reconstruction in total intensity does not depend on the gains. Residual gain and leakage corruptions may affect the reconstruction in linear polarization. However, we have evaluated the impact of these corruptions in Paper II for the same synthetic movie. We found that the effect of residual leakage errors is small, in line with the claims made by (Martí-Vidal & Marcaide 2008), making the current data set sufficient for testing purposes. Finally, we refer to ongoing work in recovering the polarimetric signal directly from the closure traces, a closure product that is independent against any gain and leakage corruptions (Broderick et al. 2020a). A first pioneering work has been done by Albentosa-Ruiz & Marti-Vidal (2023) as a modeling approach that has been extended to imaging with MOEA/D and MO-PSO in Müller (2024).
For more details on the simulation, we refer to Roelofs et al. (2023) and Chatterjee et al. (2023). We show the ground truth movie in Fig. 3. A synthetic observation of the model movie with the EHT+ngEHT array was conducted following the procedure outlined in Roelofs et al. (2023). This configuration consists of all current EHT antennas and ten additional antennas from a list of proposed sites by Raymond et al. (2021). We split the observation into scans of ten minutes in length and gaps of two minutes between scans, as was done in Paper II.
We show the recovered reconstruction in Fig. 4. The polari-metric movie was recovered with snapshots of six minutes in the time window with the best uv-coverage, as reported by Roelofs et al. (2023). The selection of the time window was based on the coverage analysis metrics presented in Farah et al. (2022). For better comparison we show single snapshots in Fig. 5. The ringlike image of the black hole shadow is successfully recovered at every keyframe with varying brightness asymmetry. Moreover, we successfully recover some hints for the dynamics at the event horizon in the form of a shearing hotspot. The overall electric vector polarization angle (EVPA) pattern (orientation and strengths) and its dynamics are successfully recovered in all keyframes. There are however minor differences in the plotted EVPA ticks. Here we would like to note that the ticks at the edge of the ring a supported in a region with limited total intensity and are less reliable. Furthermore, the ground truth model contains structures on smaller scales than the beam resolution, which makes the recovered polarization structure appear more scrambled. In Fig. C.1, we show the recovered and ground truth model when regridded to a smaller resolution, showing a significantly improved match between the synthetic data and the reconstruction.
We presented the same figures in Paper II for the reconstruction with MOEA/D4. However, we note that MOEA/D is limited by the number of pixels, as discussed in Paper II, due to issues with the numerical performance. These issues have been waived for MO-PSO, as discussed in Sect. 7.1. Therefore, we recover the movie with a larger number of pixels, and effectively a better resolution than the reconstruction that was presented in Paper II. However, to facilitate performance comparisions with the MOEA/D reconstruction, we present in Appendix C the recovered movie regridded to the resolution of MOEA/D.
To quantify the accuracy of the reconstruction, and allow the comparison with previous works, we present here the same metrics that were used in Paper II. In Fig. 6, we represent the angular time evolution by the phase-diagram proposed by Mus & Martí-Vidal (2024), while in Fig. 7 we show the angle of the brightest pixel in the ring (tracking the hotspot movement) and the cross-correlation in every scan (in total intensity). These figures suggest that the overall angular distribution is recovered well in every scan except for some frames at the beginning where the reconstructions lag behind the rapid evolution of the ground truth. For comparisons, we also reprint the scoring of the MOEA/D reconstructions in Figs. 6 and 7 from Paper II. MOEA/D recovered the movie at a lower resolution, which explains some of the differences, particularly the coarser structure in the phase-diagram in Fig. 6. To allow for quantitative comparisons, we show the cross-correlation to the ground truth movie blurred to the MOEA/D resolution for MOEA/D in Fig. 7. MOEA/D performs well in recovering the structure and angular evolution in most of the keyframes. The phase-diagram indicates that the reconstruction fidelity has been greatly improved by MO-PSO which is mirrored by the superior cross-correlation in almost every scan. Notably, the cross-correlation of the MO-PSO has relatively large values (~0.8) in the first scans of rapid evolution in which MOEA/D failed.
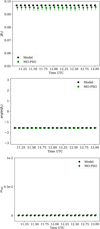
The quality of the polarimetric reconstructions as a function of time are shown in Figs. 8–10. Figures 8 and 9 depict the amplitude and phase of the β2 parameter introduced by Palumbo et al. (2020); β2 traces the orientation, twistiness, and amplitude of the polarimetric signal. Additionally, Fig. 10 illustrates the net polarization as introduced in Sect. 5.3 (Event Horizon Telescope Collaboration 2021). The polarized features are recovered very well, even for the rapidly evolving first part of the movie. We show the reconstructions of the polarimetric quantities by MOEA/D from Paper II, and note that MO-PSO performs better. However, the effect of a higher resolution is visible again (i.e., we compare the MOEA/D reconstructions against a ground truth movie at the higher MO-PSO resolution). Since the computation of β2 includes an alignment of the images on the same center, there is a slight error that could occur from the alignment of the reconstruction to the ground truth. We estimated the error of the alignment by misaligning the images by one pixel toward the north, east, west, and south and recomputing β2 by applying the same strategy that was adapted in Paper II. The true β2 and recovered β2 match in almost all scans within one standard deviation.
We achieve a successful reconstruction of a dynamic, polarimetric movie with a time-regularization approach that is simpler than some other works (e.g., Bouman et al. 2017; Leong et al. 2023). However, as already demonstrated in Paper II, MO-PSO does not need sophisticated prior information for temporal regu-larization; instead, it maps the uncertainties in the scan-to-scan variability in the Pareto front (instead of the regularizer) and navigates the temporal correlation by investigation of the Pareto front.
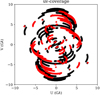 |
Fig. 2 uv-coverage for SgrA* April 11 2017 EHT (red dots) and ngEHT at 230 GHz (black crosses). |
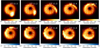 |
Fig. 3 True movie of the ngEHT Challenge 3 synthetic data (Roelofs et al. 2023). The observation has been divided into ten keyframes. The EVPAs are represented as lines and the corresponding polarization fraction is color-coded (darker blue means stronger m). The intensity of the source is represented by the other color bar. |
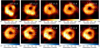 |
Fig. 4 Recovered PSO movie of the ngEHT Challenge 3 synthetic data (Roeloſs et al. 2023). |
 |
Fig. 5 Keyframe comparison between the true movie (left) and the recovered PSO movie (right). The keyframe time is shown above each pair. |
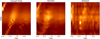 |
Fig. 6 Phase-diagram that shows the angular brightness distribution as a function of time comparing the ground truth movie (left panel), and the recovered movie (right panel). |
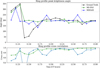 |
Fig. 7 Performance comparison between MO-PSO and MOEA/D in recovering the ring structure. The top panel shows the angle of the brightest pixel in the ring as a function of time comparing the ground truth and the recovered solution. The bottom panel depicts the cross-correlation between the ground truth and the recovered solution in every scan. |
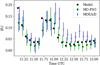 |
Fig. 8 Amplitude of β2 as a function of time comparing the ground truth movie (black) and the recovered movie (green). The errorbars represent the alignment error. |
 |
Fig. 9 Phase of β2 as a function of time. The errorbars represent the alignment error. |
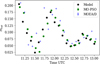 |
Fig. 10 Net polarization as a function of time. |
10 Regularizer characterization
MO-PSO presents two main advantages in comparison with MOEA/D. On the one hand, there is no need to grid the hyperpa-rameter space (we let the weights change during the optimization process) and, with a high number of pixels, this discretization makes the resulting image artificially pixelated. When a thin mesh is used, each pixel has its own weight combination. Moreover, the higher the number of pixels or the number ofobjectives, the more complex (Curry & Dagli 2014) the whole MOEA strategy is. In this algorithm the number of pixels only affects the optimization step.
On the other hand, to study each regularizer separately allows us to investigate the marginal contribution of each regularizer in the final image. In other words, we can know how important each fi is and how it affects the final geometry. However, in contrast to full Bayesian exploration techniques, the final distribution of the particle swarm should not be interpreted as a posterior in the sense of Bayesian imaging.
We executed Algorithm 1 on multiple instances, initiating it 100 times with 25 new particles in each run (utilizing the randomized nature of particle swarm optimization with multiple seeds). From these iterations, we saved the optimal weight values associated with the algorithm’s convergence. Our aim was to examine the distribution of these optimal weights to explore the variance and its correlation with the quality of the resulting images.
Our anticipation was that if the images obtained were similar in quality, the respective optimal weights would exhibit close proximity. A notable standard deviation among these weights, while still yielding comparable reconstructed images, suggests that specific regularizers might not significantly impact the reconstruction. This observation stems from the notion that despite variations in their weights, the resulting images maintain consistency.
10.1 Synthetic EHT-like data
We conducted a survey involving the reconstruction of four standard geometric models (double, ring, crescent, and disk) with synthetic observations using the 2017 April 11 EHT coverage toward Sgr A*. The results are presented in Fig. A.1.
The top row (R1) displays box-plot distributions of the marginal distributions of each regularizer: l1-norm, tv, tsv, l2-norm, flux, and entropy, for each model. The l1-norm generally is in the interval (0.1, 1) for 75% of cases, signifying its higher impact compared to entropy, which exhibits a wider range (being less critical in the final image reconstruction). Notably, in the case of the ring model, the flux regularizer takes precedence over others, playing a pivotal role in achieving a high-quality image. The second and third rows show the model images and the best reconstructed image, in terms of the nxcorr for each case. The last row (R4) presents the nxcorr distribution for every model. In all cases, all the weight combinations in the final population of the swarm show a nxcorr exceeding 0.92. Although the double model exhibits a slightly broader distribution with a mean nxcorr around 0.94, the remaining images display minimal nxcorr dispersion, indicating their satisfactory quality in each run of MO-PSO. This also demonstrates the performance and reconstruction accuracy of MO-PSO. Across multiple geometric models, and in every single instance of the particle swarm optimization, MO-PSO finds a suitable reconstruction of the image, and a parameter combination that would pass the top selection criterion for this single source defined by Event Horizon Telescope Collaboration (2019).
10.2 M87 real data
We show in Fig. A.2 the relative importance of the regularizers for M87* (see Sect. 8). We first note that all reconstructions have nxcorr with respect to the published image by the EHT (Event Horizon Telescope Collaboration 2019) greater than 0.9 and a mean of ~0.94. This serves as a convincing alternative verification of the EHT results on M87. The intrinsic morphology of the source makes its reconstruction a bit more challenging than the synthetic geometric models, as expected.
Second, we can observe that the weights associated with the Rflux and  are more constrained, but the rest of the hyperpa-rameters have less dispersion than the geometric models, while the entropy and l2 accept greater variation. The range of better values for the regularizers is ~ (1e−3, 0.5). The box-plot representation is more similar to the double, ring, or crescent than to the disk. Regularizers used for the double, ring, or crescent are better options than those for the disk.
11 Summary and conclusions
Imaging reconstruction of interferometric data is a challenging ill-posed problem, particularly when dealing with very sparse uv-coverage, as is often the case in global VLBI observations. These challenges are amplified when working with polarimetric data or attempting to capture the dynamic behavior of the source, and become even more complex when attempting to reconstruct all these aspects together.
While static polarimetry imaging has been extensively studied in the past Ponsonby (1973); Narayan & Nityananda (1986); Holdaway & Wardle (1988); Coughlan & Gabuzda (2013); Chael et al. (2016), solving the nonconvex problem of polarimetric dynamic imaging remains an open challenge.
The intricacies presented by rapidly evolving sources, such as the case of Sgr A* (Event Horizon Telescope Collaboration 2022) have motivated the VLBI community to develop innovative algorithms capable of effectively addressing variability concerns. The inherent limitations of snapshot imaging due to restricted coverage and the potential loss of information resulting from temporal averaging highlight the necessity for the formulation of functionals that can efficiently mitigate such information loss.
In previous works (Paper I and Paper II), we introduced the MOEA/D algorithm, a full Stokes dynamic multiobjective optimization problem to recover unsupervised a set of local minima. However, this algorithm has some limitations. In particular, its high computational complexity and the gridding of the space could provoke different pixels in the same image to have different associated weights, producing reconstructions with artifacts. Moreover, an ad hoc rescaling value was needed to avoid numerical problems during the genetic operations.
The alternative, classical RML approaches paired with a parameter survey strategy proved successful in robustly recovering a wide range of image features even for very challenging data sets. They quickly produce a single maximum a posteori solution given a specific set of weights, but the survey strategy takes time and relies on synthetic data.
In this work, we developed a novel approach, MO-PSO, to solve the image reconstruction problem aiming to combine the best of RML and MOEA/D. MO-PSO keeps most of the advantages of MOEA/D as a multiobjective, easily adaptable, global, and self-consistently unsupervised search technique and overcomes its limitations with regard to numerical complexity and gridding. We searched for the optimal weights of a multiobjec-tive optimization problem, and then we obtained the associated image. One main advantage of this approach is that finding the optimal weights is a convex problem, and thus it has a unique global solution. In addition, our algorithm is as flexible as MOEA/D, and allows us to study and to characterize the marginal contribution of each regularization term with respect to the final (full Stokes dynamic/static) reconstruction.
Acknowledgements
H.M. and A.M. have contributed equally to this work. This work was partially supported by the M2FINDERS project funded by the European Research Council (ERC) under the European Union’s Horizon 2020 Research and Innovation Programme (Grant Agreement No. 101018682) and by the MICINN Research Project PID2019-108995GB-C22. A.M. also thanks the Generalitat Valenciana for funding, in the frame of the GenT Project CIDEGENT/2018/021. HM received financial support for this research from the International Max Planck Research School (IMPRS) for Astronomy and Astrophysics at the Universities of Bonn and Cologne. Software Availability. Our imaging pipeline and our software is included in the second release of MrBeam5. Our software makes use of the publicly available ehtim (Chael et al. 2016, 2018), regpy (Regpy 2019), MrBeam (Müller & Lobanov 2022, 2023b,a) and pyswarms6 packages.
Appendix A Additional figures
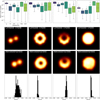 |
Fig. A.1 Relation between images and regularizers. Top row: Marginal contribution of each regularizer for each model: double, ring, crescent, and disk (from left to right). The box represents the quartiles, the black line the mean, and the whiskers the rest of the distribution. Empty circles are outliers. Second and third rows: Ground truth and the best (in terms of nxcorr) reconstructed image. Bottom row: nxcorr distribution for every element in the survey. |
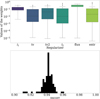 |
Fig. A.2 Relation between regularizers and image similarity of real M87* data. Top panel: Marginal contribution of each of the regularizes for the M87 April 11 image. The black continuous line represents the mean, and the boxes contain 75% of the values. Bottom panel: nxcorr distribution. Most of images have nxcorr ~0.94. The nxcorr of the images ranges between ~0.91 and ~0.96. |
Appendix B Polarimetry
To demonstrate the capabilities of PSO imaging in the polarimet-ric domain, we replicated the experiments presented in Müller & Lobanov (2023a) and Mus et al. (2024), using a synthetic data source from the ehtim software package (Chael et al. 2016, 2018).
For the polarimetric reconstruction, we followed a similar strategy to the one we used for Paper II, where we fixed the Stokes I reconstruction and only solved for linear polarization. We initialized the initial population with images with constant EVPA at a constant polarization fraction of 1% across the whole field of view. Rather than solve for Q and U separately, we equiv-alently modeled the linear polarization by the linear polarization fraction m and the mixing angle χ:
 (B.1)
(B.1)
This turns out to be beneficial since inequality (3) is automatically satisfied by imposing 0 ≤ m ≤ 1; specifically, we cannot create spurious polarimetric signals outside of the total intensity contours.
To verify that PSO reconstructions performs well for a wider range of EVPA structures, we performed a number of additional tests with an artificial ring image and different EVPA patterns (vertical magnetic field, toroidal magnetic field, and a radial magnetic field). Figures B.1, B.2, and B.3 show the true model (left panel) and the recovered PSO image (right panel). The reconstruction of the overall pattern is successful in all four cases. In conclusion, we can differentiate various magnetic field configurations by the PSO reconstructions of EHT-like data.
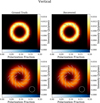 |
Fig. B.1 Simulated ring-like source with vertical EVPAs using the EHT 2017 coverage and array properties. Left panel: Ground truth. Right panel: PSO reconstrucion (solution). The top panel show the reconstructions at full resolution; the bottom panels are blurred with a resolution of 20 µas. The straight lines represent the EVPAs, and the color-coding represents the amount of polarization fraction. The color map for the brightness of the source is different to that for the EVPAs. |
Appendix C Recovered Movie at MOEA/D resolution
We show the recovered movie with MO-PSO in Fig. 4. The same observation data were recovered already in Mus et al. (2024) with MOEA/D, although with a lower resolution due to the limitations with respect to numerical performance. To simplify the comparisons, we present in Fig. C.1 the recovered movie with MO-PSO, but regridded to the same resolution and field of view as presented in Paper II.
Dynamics null test
We show how the time regularizer does not create an unexpected dynamic behavior. If the source is static, ngMEM does not bias the image. To this end, we simulated a ring using the ngEHT+EHT array displayed in Fig. C.2, and we divided the observation into the same keyframes as in Fig. 4.
As can be seen in Fig. C.3, the EVPA and fractional polarization is correctly recovered, without time evolution bias.
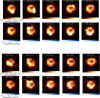 |
Fig. C.1 Same as Fig. 4, but regridded to the field of view 180µas and resolution 10µas, as was used in Paper II. Top: True movie. Bottom: Recovered. |
References
- Akiyama, K., Ikeda, S., Pleau, M., et al. 2017a, AJ, 153, 159 [NASA ADS] [CrossRef] [Google Scholar]
- Akiyama, K., Kuramochi, K., Ikeda, S., et al. 2017b, ApJ, 838, 1 [NASA ADS] [CrossRef] [Google Scholar]
- Albentosa-Ruiz, E., & Marti-Vidal, I. 2023, A&A, 672, A67 [NASA ADS] [CrossRef] [EDP Sciences] [Google Scholar]
- Arras, P., Frank, P., Leike, R., Westermann, R., & Enßlin, T. A. 2019, A&A, 627, A134 [NASA ADS] [CrossRef] [EDP Sciences] [Google Scholar]
- Arras, P., Bester, H. L., Perley, R. A., et al. 2021, A&A, 646, A84 [NASA ADS] [CrossRef] [EDP Sciences] [Google Scholar]
- Arras, P., Frank, P., Haim, P., et al. 2022, Nat. Astron., 6, 259 [NASA ADS] [CrossRef] [Google Scholar]
- Bhatnagar, S., & Cornwell, T. J. 2004, A&A, 426, 747 [NASA ADS] [CrossRef] [EDP Sciences] [Google Scholar]
- Bouman, K. L., Johnson, M. D., Dalca, A. V., et al. 2017, arXiv e-prints [arXiv:1711.01357] [Google Scholar]
- Broderick, A. E., Fish, V. L., Johnson, M. D., et al. 2016, ApJ, 820, 137 [Google Scholar]
- Broderick, A. E., Gold, R., Karami, M., et al. 2020a, ApJ, 897, 139 [Google Scholar]
- Broderick, A. E., Pesce, D. W., Tiede, P., Pu, H.-Y., & Gold, R. 2020b, ApJ, 898, 9 [Google Scholar]
- Byrd, R. H., Lu, P., & Nocedal, J. 1995, SIAM J. Sci. Statist. Comput., 16, 1190 [NASA ADS] [CrossRef] [Google Scholar]
- Chael, A. A., Johnson, M. D., Narayan, R., et al. 2016, ApJ, 829, 11 [Google Scholar]
- Chael, A. A., Johnson, M. D., Bouman, K. L., et al. 2018, ApJ, 857, 23 [Google Scholar]
- Chatterjee, K., Chael, A., Tiede, P., et al. 2023, Galaxies, 11, 38 [NASA ADS] [CrossRef] [Google Scholar]
- Clark, B. G. 1980, A&A, 89, 377 [NASA ADS] [Google Scholar]
- Cornwell, T. J. 2008, IEEE J. Selected Top. Signal Process., 2, 793 [NASA ADS] [CrossRef] [Google Scholar]
- Coughlan, C. P., & Gabuzda, D. C. 2013, Eur. Phys. J. Web Conf., 61, 07009 [NASA ADS] [CrossRef] [EDP Sciences] [Google Scholar]
- Curry, D. M., & Dagli, C. H. 2014, Procedia Comput. Sci., 36, 185 [NASA ADS] [CrossRef] [Google Scholar]
- Du, K.-L., & Swamy, M. N. S. 2016, Search and Optimization by Metaheuristics: Techniques and Algorithms Inspired by Nature, 1st edn. (Birkhäuser Basel) [CrossRef] [Google Scholar]
- Event Horizon Telescope Collaboration (Akiyama, K., et al.) 2019, ApJ, 875, L4 [Google Scholar]
- Event Horizon Telescope Collaboration (Akiyama, K., et al.) 2021, ApJ, 910, 48 [CrossRef] [Google Scholar]
- Event Horizon Telescope Collaboration (Akiyama, K., et al.) 2022, ApJ, 930, L14 [NASA ADS] [CrossRef] [Google Scholar]
- Farah, J., Galison, P., Akiyama, K., et al. 2022, ApJ, 930, 1 [Google Scholar]
- GRAVITY Collaboration (Abuter, R., et al.) 2018, A&A, 615, L15 [NASA ADS] [CrossRef] [EDP Sciences] [Google Scholar]
- Högbom, J. A. 1974, A&AS, 15, 417 [Google Scholar]
- Holdaway, M. A., & Wardle, J. F. C. 1988, in Bull. Am. Astron. Soc., 20, 1065 [NASA ADS] [Google Scholar]
- Honma, M., Akiyama, K., Uemura, M., & Ikeda, S. 2014, PASJ, 66, 95 [Google Scholar]
- Leong, O., Gao, A. F., Sun, H., & Bouman, K. L. 2023, arXiv e-prints [arXiv:2304.05589] [Google Scholar]
- Martí-Vidal, I., & Marcaide, J. M. 2008, A&A, 480, 289 [CrossRef] [EDP Sciences] [Google Scholar]
- Müller, H. 2024, A&A, submitted [Google Scholar]
- Müller, H., & Lobanov, A. P. 2022, A&A, 666, A137 [NASA ADS] [CrossRef] [EDP Sciences] [Google Scholar]
- Müller, H., & Lobanov, A. P. 2023a, A&A, 673, A151 [NASA ADS] [CrossRef] [EDP Sciences] [Google Scholar]
- Müller, H. & Lobanov, A. P. 2023b, A&A, 672, A26 [NASA ADS] [CrossRef] [EDP Sciences] [Google Scholar]
- Müller, H., Mus, A., & Lobanov, A. 2023, A&A, 675, A60 [NASA ADS] [CrossRef] [EDP Sciences] [Google Scholar]
- Mus, A. 2023, PhD thesis, Universitat de Valéncia, Spain [Google Scholar]
- Mus, A., & Martí-Vidal, I. 2024, MNRAS, 528, 5537 [NASA ADS] [CrossRef] [Google Scholar]
- Mus, A., Müller, H., Martí-Vidal, I., & Lobanov, A. 2024, A&A, 684, A55 [NASA ADS] [CrossRef] [EDP Sciences] [Google Scholar]
- Narayan, R., & Nityananda, R. 1986, ARA&A, 24, 127 [Google Scholar]
- Offringa, A. R., McKinley, B., Hurley-Walker, N., et al. 2014, MNRAS, 444, 606 [Google Scholar]
- Palumbo, D. C. M., Wong, G. N., & Prather, B. S. 2020, ApJ, 894, 156 [Google Scholar]
- Pardalos, P. M., Žilinskas, A., & Žilinskas, J. 2017, Non-Convex Multi-Objective Optimization [CrossRef] [Google Scholar]
- Ponsonby, J. E. B. 1973, MNRAS, 163, 369 [NASA ADS] [CrossRef] [Google Scholar]
- Rau, U., & Cornwell, T. J. 2011, A&A, 532, A71 [NASA ADS] [CrossRef] [EDP Sciences] [Google Scholar]
- Raymond, A. W., Palumbo, D., Paine, S. N., et al. 2021, ApJS, 253, 5 [Google Scholar]
- Regpy 2019, Regpy: Python tools for regularization methods, https://github.com/regpy/regpy [Google Scholar]
- Roelofs, F., Blackburn, L., Lindahl, G., et al. 2023, Galaxies, 11, 12 [NASA ADS] [CrossRef] [Google Scholar]
- Thompson, A. R., Moran, J. M., & Swenson, George W., J. 2017, Interferometry and Synthesis in Radio Astronomy, 3rd edn [Google Scholar]
- Thyagarajan, N., Hoefs, L., & Wong, O. I. 2023, arXiv e-prints [arXiv:2311.06349] [Google Scholar]
- Tiede, P. 2022, J. Open Source Softw., 7, 4457 [NASA ADS] [CrossRef] [Google Scholar]
- Tiede, P., Pu, H.-Y., Broderick, A. E., et al. 2020, ApJ, 892, 132 [NASA ADS] [CrossRef] [Google Scholar]
- Zhang, Q., & Li, H. 2007, IEEE Trans. Evol. Computat., 11, 712 [CrossRef] [Google Scholar]
The initial distribution can change, if the user desires.
With respect to numerical precision.
We refer to Paper II for reconstructions of this same synthetic data set using MOEA/D.
All Figures
|
Fig. 1 Reconstruction of M87 on April 11, 2017, using PSO algorithm, with 25 particles. |
| In the text | |
|
Fig. 2 uv-coverage for SgrA* April 11 2017 EHT (red dots) and ngEHT at 230 GHz (black crosses). |
| In the text | |
|
Fig. 3 True movie of the ngEHT Challenge 3 synthetic data (Roelofs et al. 2023). The observation has been divided into ten keyframes. The EVPAs are represented as lines and the corresponding polarization fraction is color-coded (darker blue means stronger m). The intensity of the source is represented by the other color bar. |
| In the text | |
|
Fig. 4 Recovered PSO movie of the ngEHT Challenge 3 synthetic data (Roeloſs et al. 2023). |
| In the text | |
|
Fig. 5 Keyframe comparison between the true movie (left) and the recovered PSO movie (right). The keyframe time is shown above each pair. |
| In the text | |
|
Fig. 6 Phase-diagram that shows the angular brightness distribution as a function of time comparing the ground truth movie (left panel), and the recovered movie (right panel). |
| In the text | |
|
Fig. 7 Performance comparison between MO-PSO and MOEA/D in recovering the ring structure. The top panel shows the angle of the brightest pixel in the ring as a function of time comparing the ground truth and the recovered solution. The bottom panel depicts the cross-correlation between the ground truth and the recovered solution in every scan. |
| In the text | |
|
Fig. 8 Amplitude of β2 as a function of time comparing the ground truth movie (black) and the recovered movie (green). The errorbars represent the alignment error. |
| In the text | |
|
Fig. 9 Phase of β2 as a function of time. The errorbars represent the alignment error. |
| In the text | |
|
Fig. 10 Net polarization as a function of time. |
| In the text | |
|
Fig. A.1 Relation between images and regularizers. Top row: Marginal contribution of each regularizer for each model: double, ring, crescent, and disk (from left to right). The box represents the quartiles, the black line the mean, and the whiskers the rest of the distribution. Empty circles are outliers. Second and third rows: Ground truth and the best (in terms of nxcorr) reconstructed image. Bottom row: nxcorr distribution for every element in the survey. |
| In the text | |
|
Fig. A.2 Relation between regularizers and image similarity of real M87* data. Top panel: Marginal contribution of each of the regularizes for the M87 April 11 image. The black continuous line represents the mean, and the boxes contain 75% of the values. Bottom panel: nxcorr distribution. Most of images have nxcorr ~0.94. The nxcorr of the images ranges between ~0.91 and ~0.96. |
| In the text | |
|
Fig. B.1 Simulated ring-like source with vertical EVPAs using the EHT 2017 coverage and array properties. Left panel: Ground truth. Right panel: PSO reconstrucion (solution). The top panel show the reconstructions at full resolution; the bottom panels are blurred with a resolution of 20 µas. The straight lines represent the EVPAs, and the color-coding represents the amount of polarization fraction. The color map for the brightness of the source is different to that for the EVPAs. |
| In the text | |
 |
Fig. B.2 Same as Fig. B.2, but for a toroidal magnetic field. |
| In the text | |
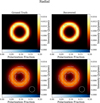 |
Fig. B.3 Same as Fig. B.2, but for a radial magnetic field. |
| In the text | |
|
Fig. C.1 Same as Fig. 4, but regridded to the field of view 180µas and resolution 10µas, as was used in Paper II. Top: True movie. Bottom: Recovered. |
| In the text | |
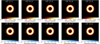 |
Fig. C.2 Static movie reconstruction using same uv-coverage and frames as in Fig. 4. |
| In the text | |
Current usage metrics show cumulative count of Article Views (full-text article views including HTML views, PDF and ePub downloads, according to the available data) and Abstracts Views on Vision4Press platform.
Data correspond to usage on the plateform after 2015. The current usage metrics is available 48-96 hours after online publication and is updated daily on week days.
Initial download of the metrics may take a while.