Fig. A.2
Download original image
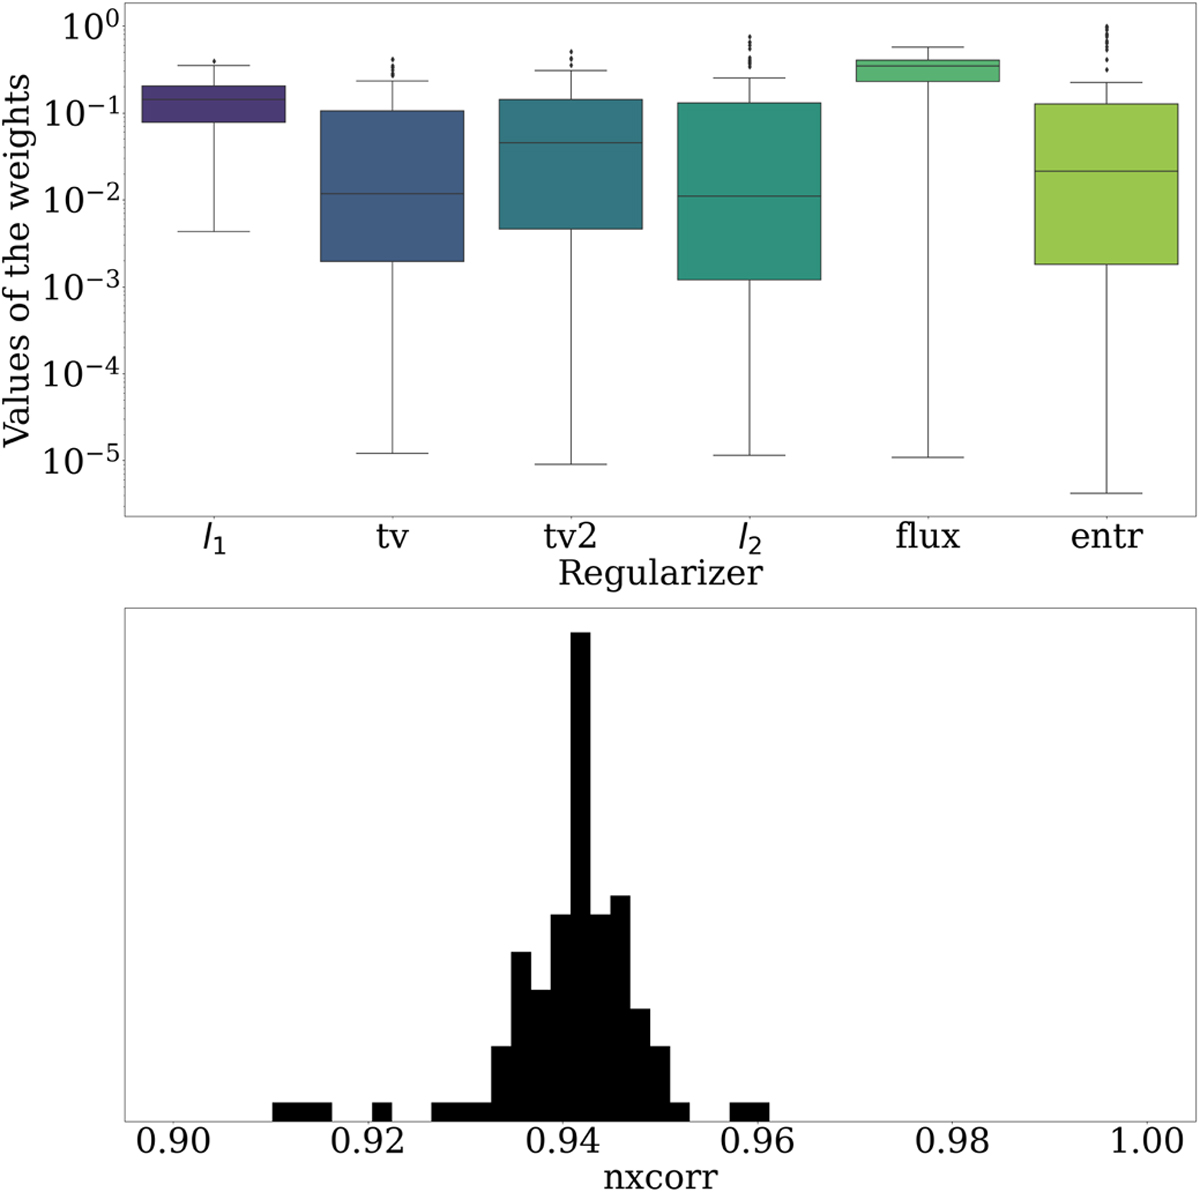
Relation between regularizers and image similarity of real M87* data. Top panel: Marginal contribution of each of the regularizes for the M87 April 11 image. The black continuous line represents the mean, and the boxes contain 75% of the values. Bottom panel: nxcorr distribution. Most of images have nxcorr ~0.94. The nxcorr of the images ranges between ~0.91 and ~0.96.
Current usage metrics show cumulative count of Article Views (full-text article views including HTML views, PDF and ePub downloads, according to the available data) and Abstracts Views on Vision4Press platform.
Data correspond to usage on the plateform after 2015. The current usage metrics is available 48-96 hours after online publication and is updated daily on week days.
Initial download of the metrics may take a while.