Fig. A.1
Download original image
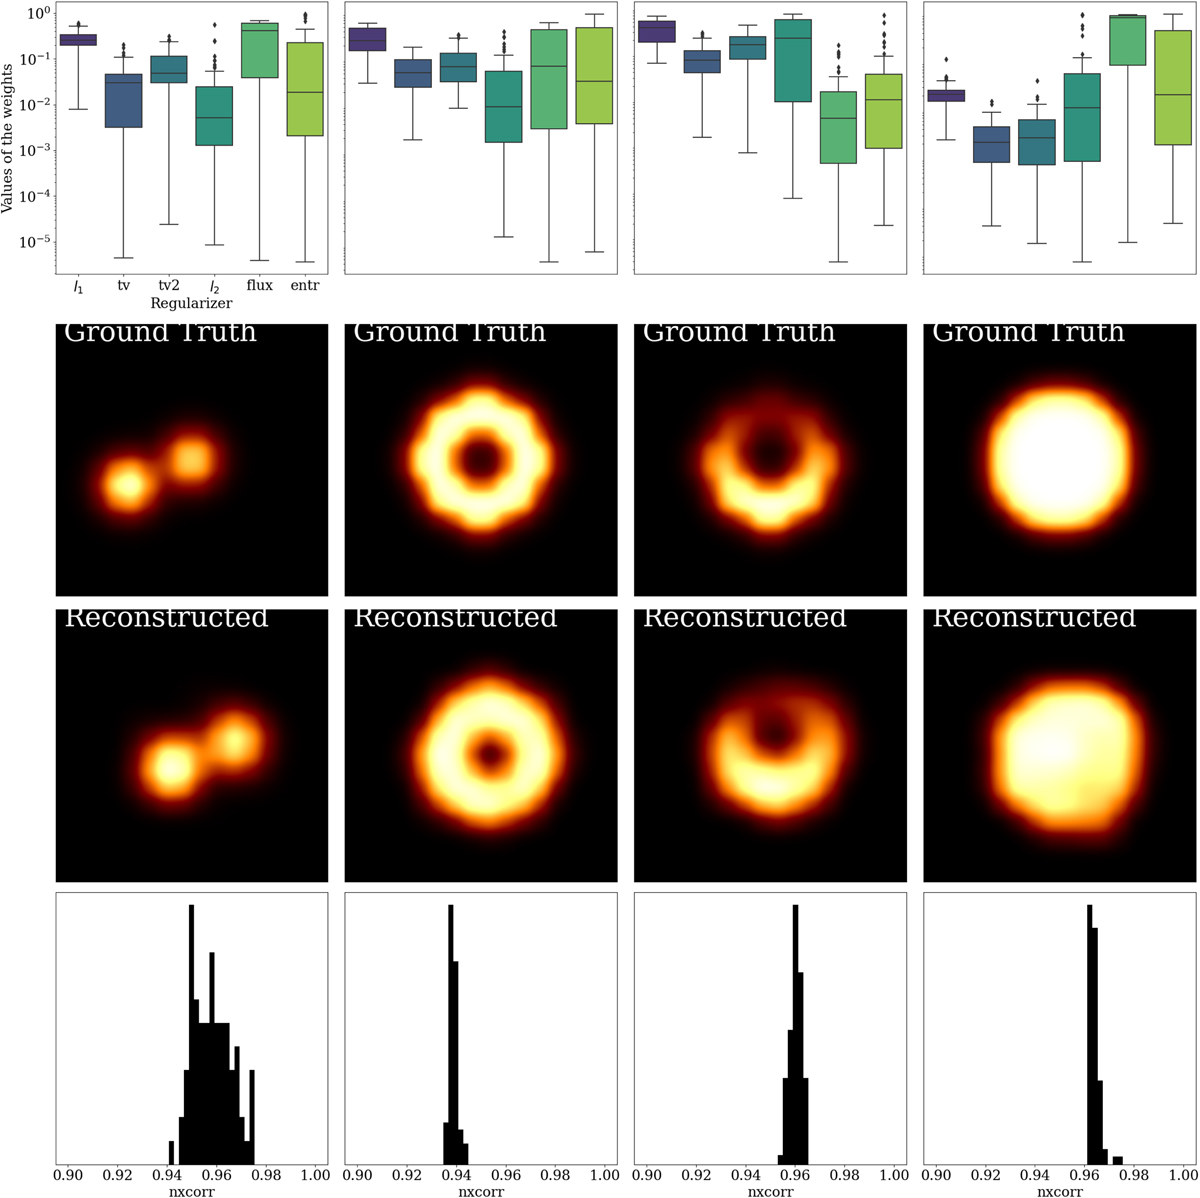
Relation between images and regularizers. Top row: Marginal contribution of each regularizer for each model: double, ring, crescent, and disk (from left to right). The box represents the quartiles, the black line the mean, and the whiskers the rest of the distribution. Empty circles are outliers. Second and third rows: Ground truth and the best (in terms of nxcorr) reconstructed image. Bottom row: nxcorr distribution for every element in the survey.
Current usage metrics show cumulative count of Article Views (full-text article views including HTML views, PDF and ePub downloads, according to the available data) and Abstracts Views on Vision4Press platform.
Data correspond to usage on the plateform after 2015. The current usage metrics is available 48-96 hours after online publication and is updated daily on week days.
Initial download of the metrics may take a while.