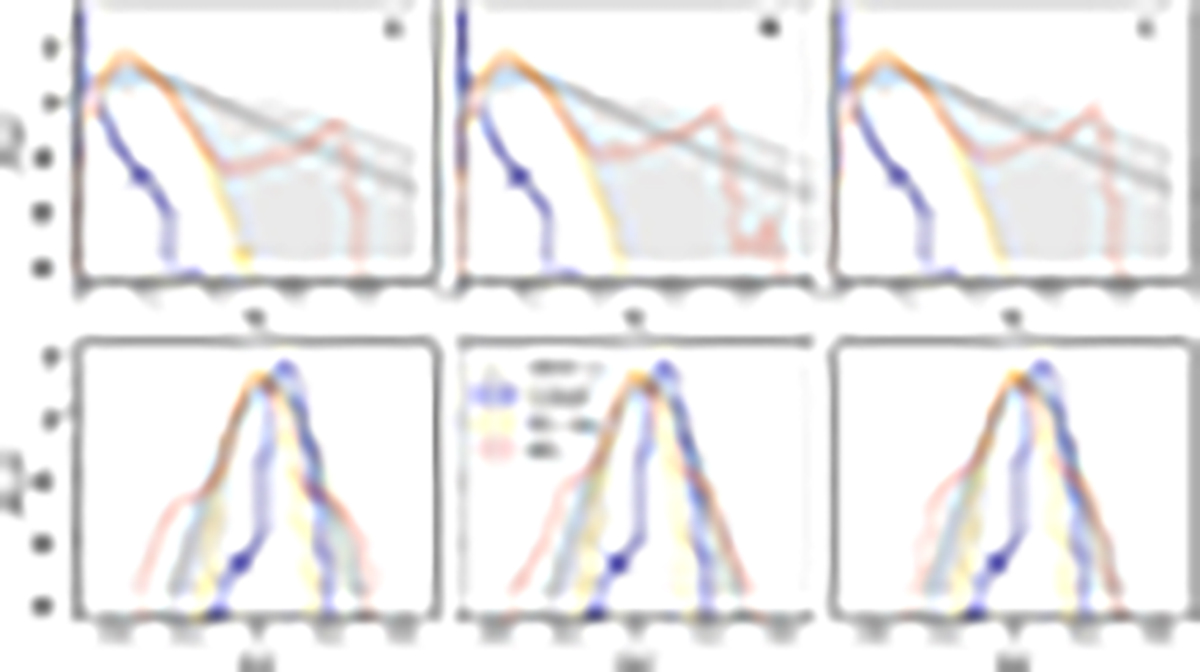
Fig. 7.
Download original image
Precessing (upper panels) and effective (lower panels) spin distribution of BBH mergers at redshift z = 0 for models A (left), B (center), and C (right) in the Tidal evolutionary case. We show the mass distribution resulting from isolated BBH mergers (blue solid line), 1g BBH mergers in GCs (yellow dash-dotted line), and BBH mergers in GCs, including hierarchical mergers (salmon dashed line). The black dashed line is the median value of the Gaussian spin model inferred from GWTC-3 (Abbott et al. 2023b). The gray shaded areas are the corresponding 90% credible intervals.
Current usage metrics show cumulative count of Article Views (full-text article views including HTML views, PDF and ePub downloads, according to the available data) and Abstracts Views on Vision4Press platform.
Data correspond to usage on the plateform after 2015. The current usage metrics is available 48-96 hours after online publication and is updated daily on week days.
Initial download of the metrics may take a while.