Fig. 3
Download original image
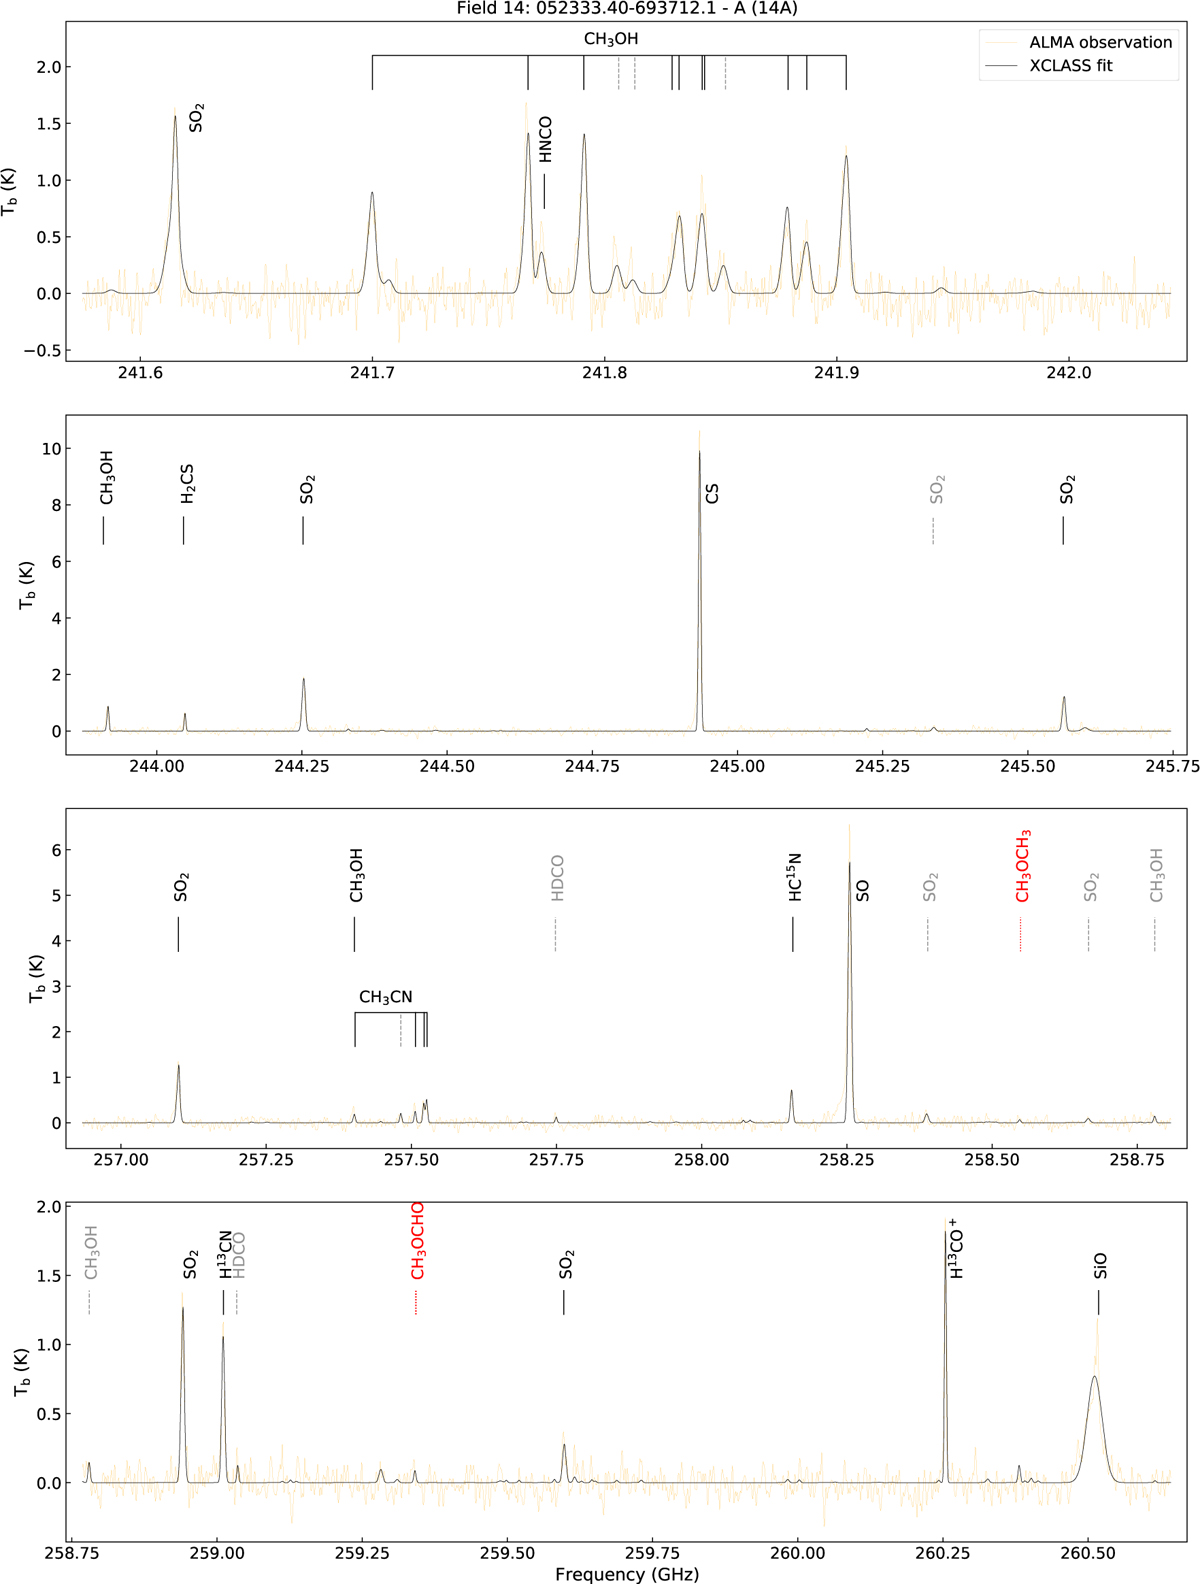
ALMA Band 6 observed spectra toward source 14A overlaid with the best-fit XCLASS model. Molecular transitions with definite detections (S/N > 5) are represented by solid black lines, while those with tentative detections (3 < S/N < 5) are denoted by dotted gray lines. Dotted red lines indicate transitions of molecules for which abundance upper limits are provided.
Current usage metrics show cumulative count of Article Views (full-text article views including HTML views, PDF and ePub downloads, according to the available data) and Abstracts Views on Vision4Press platform.
Data correspond to usage on the plateform after 2015. The current usage metrics is available 48-96 hours after online publication and is updated daily on week days.
Initial download of the metrics may take a while.