Fig. 12
Download original image
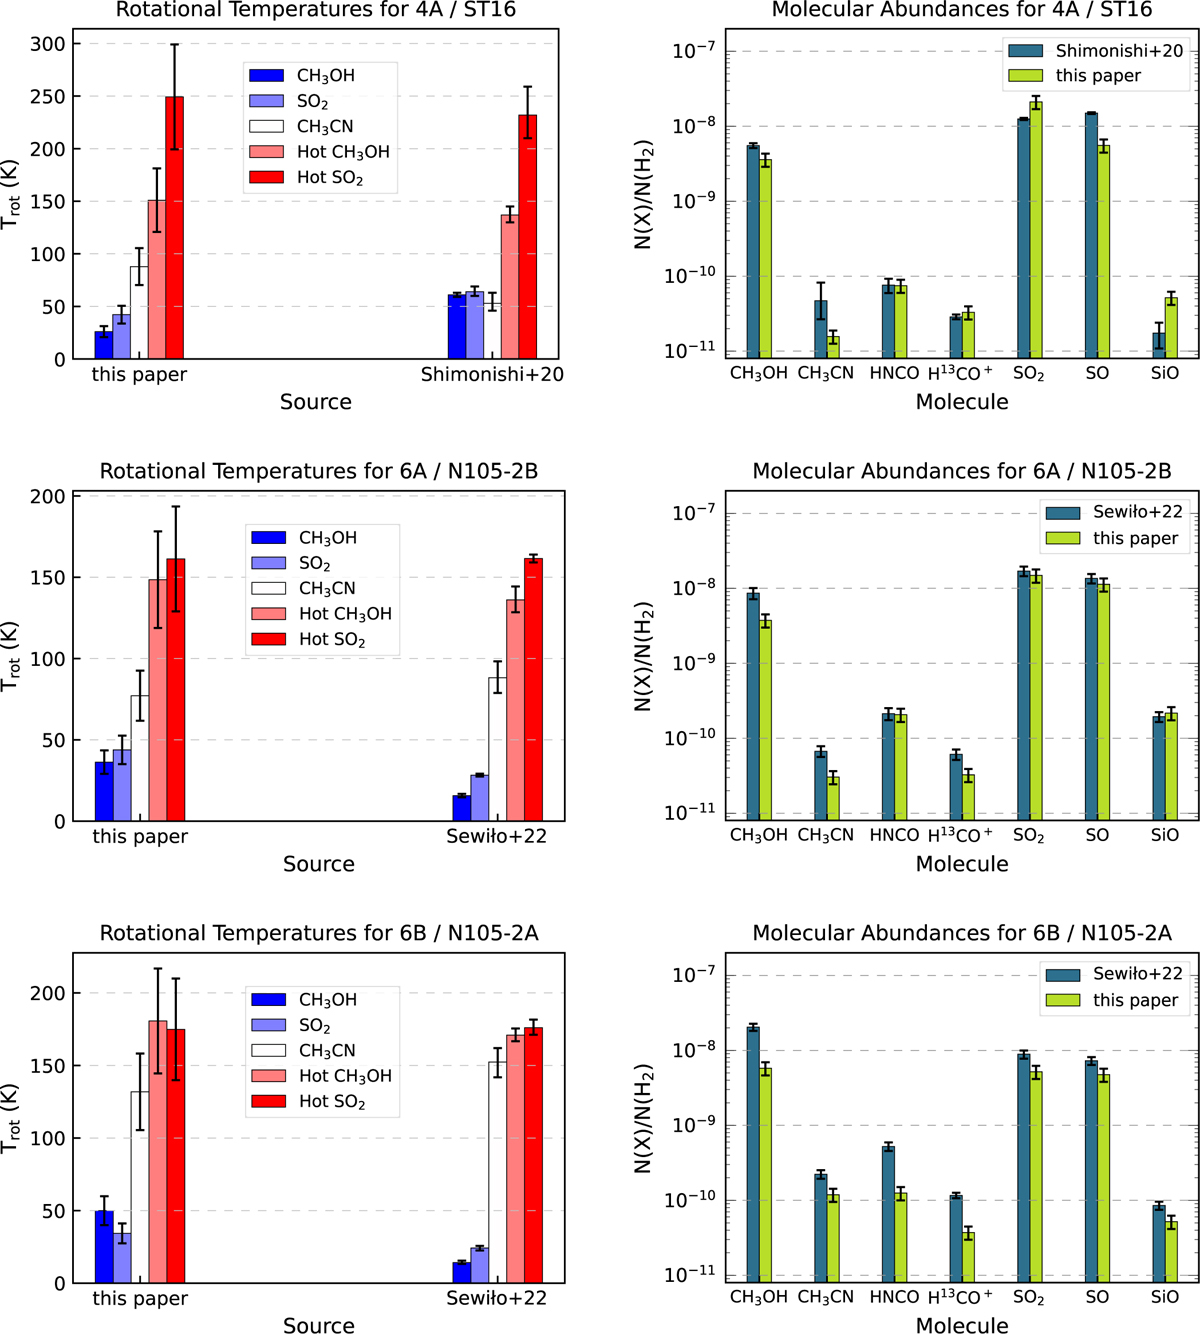
Comparisons of the derived temperatures (left) and abundances (right) from the current study and the literature. The top panels show a comparison of 4A and ST16 (Shimonishi et al. 2020), the middle panels show 6A and N105-2B, and the bottom panels show 6B and N105-2A (Sewiło et al. 2022). An error range of 40% is depicted for the temperatures and column densities from the current paper.
Current usage metrics show cumulative count of Article Views (full-text article views including HTML views, PDF and ePub downloads, according to the available data) and Abstracts Views on Vision4Press platform.
Data correspond to usage on the plateform after 2015. The current usage metrics is available 48-96 hours after online publication and is updated daily on week days.
Initial download of the metrics may take a while.