Fig. 5.
Download original image
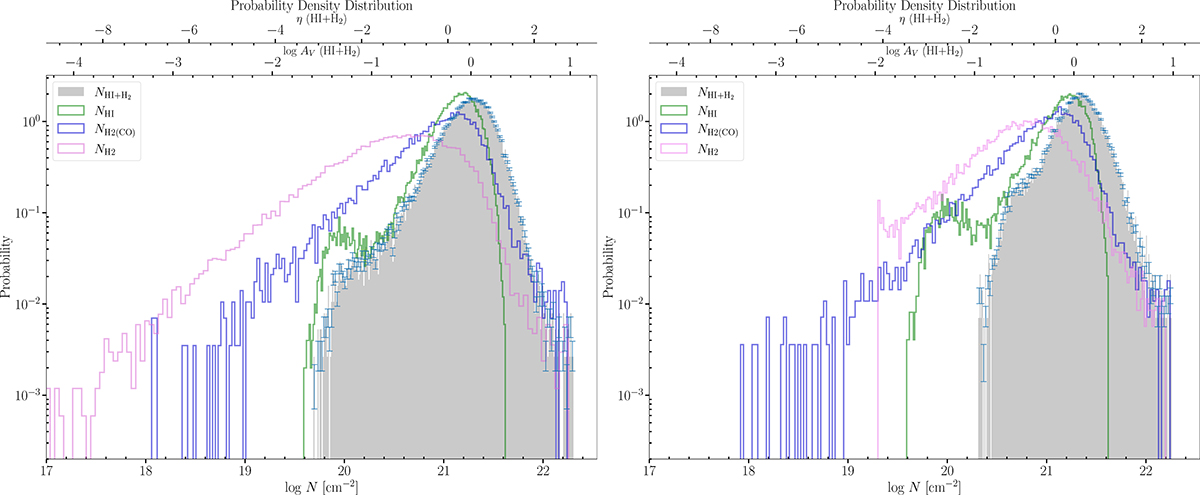
N-PDFs obtained from the various column density maps. Left: N-PDF of the high-res NH column density map derived using all Herschel dust data employing method I only for non-blanked pixels of Fig. 4. Right: N-PDF of the NH column density map derived with method II for the same non-blanked pixels of Fig. 4. The green lines show the N-PDF of H I. Here, η is defined by ![]() , where N is the column density and ⟨N⟩ the mean column density.
, where N is the column density and ⟨N⟩ the mean column density.
Current usage metrics show cumulative count of Article Views (full-text article views including HTML views, PDF and ePub downloads, according to the available data) and Abstracts Views on Vision4Press platform.
Data correspond to usage on the plateform after 2015. The current usage metrics is available 48-96 hours after online publication and is updated daily on week days.
Initial download of the metrics may take a while.