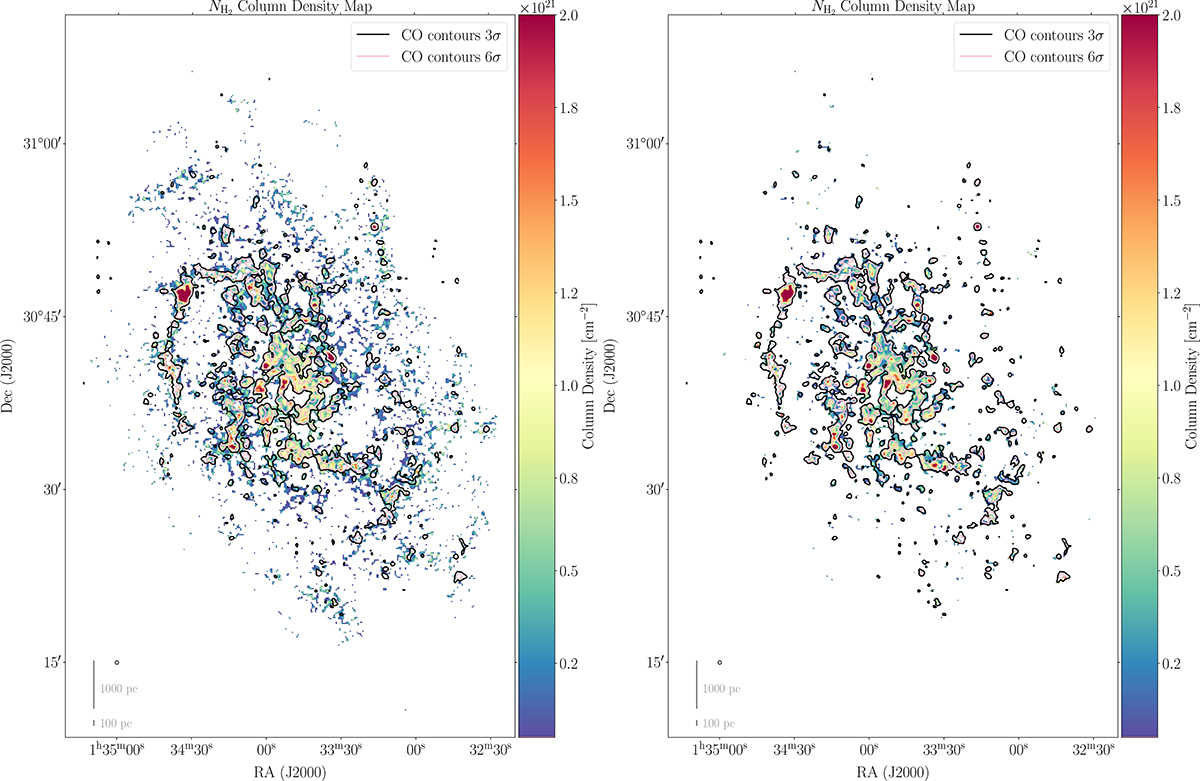
Fig. 4.
Download original image
Molecular hydrogen column density maps obtained via methods I and II. Left: high-res H2 column density map derived using all Herschel dust data employing method I with CO contours above the 3 and 6 σ level of the CO map shown in Fig. 1. Right: H2 column density map derived from SPIRE 250 μm map with method II. The circle to the lower left represents the resolution of 18.2″.
Current usage metrics show cumulative count of Article Views (full-text article views including HTML views, PDF and ePub downloads, according to the available data) and Abstracts Views on Vision4Press platform.
Data correspond to usage on the plateform after 2015. The current usage metrics is available 48-96 hours after online publication and is updated daily on week days.
Initial download of the metrics may take a while.