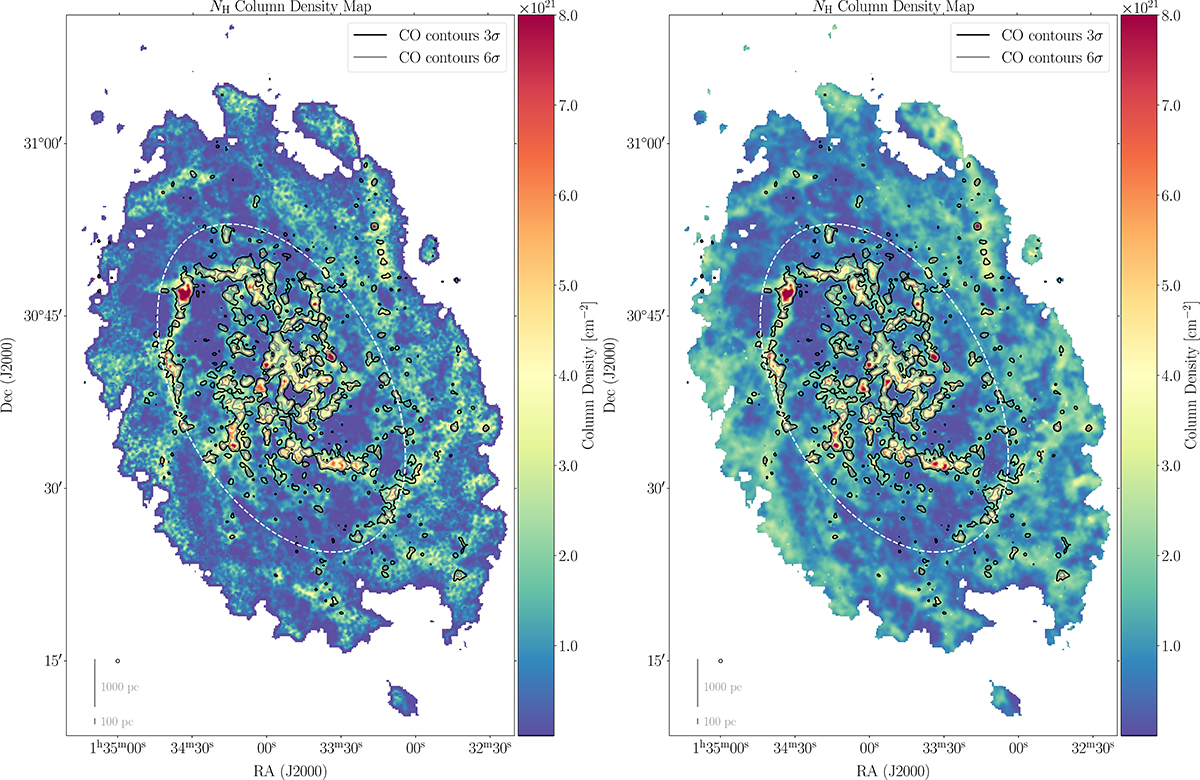
Fig. 3.
Download original image
Total hydrogen column density maps obtained via methods I and II. Left: high resolution NH total gas column density map obtained from the Herschel maps of M33 at 18.2″ angular resolution using the β map from Tabatabaei et al. (2014) with method I. Right: total gas column density map NH obtained from the Herschel SPIRE 250 μm map of M33 with method II at the same spatial resolution of 18.2″, indicated by the circle in the lower left corner. CO contours (as of Fig. 1) are overlaid in both maps. The white dashed ellipses mark roughly the regions we refer to as ‘inter-main spiral’ region or “outskirts”.
Current usage metrics show cumulative count of Article Views (full-text article views including HTML views, PDF and ePub downloads, according to the available data) and Abstracts Views on Vision4Press platform.
Data correspond to usage on the plateform after 2015. The current usage metrics is available 48-96 hours after online publication and is updated daily on week days.
Initial download of the metrics may take a while.