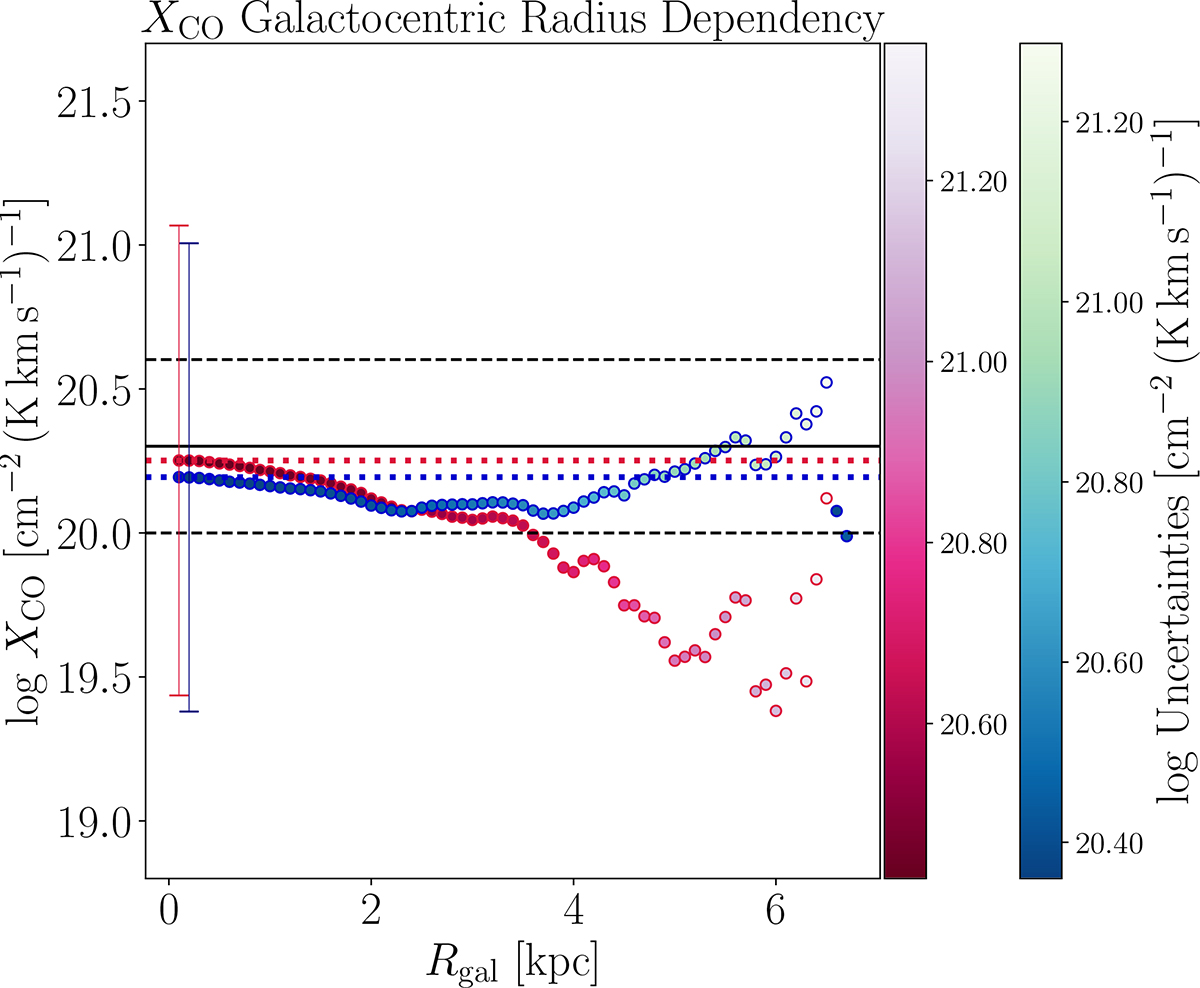
Fig. F.1.
Download original image
Radial profile of the XCO factor as a function of the galactocentric radius in bins of 100 pc. Reddish data points refer to the XCO factor obtained with method I, while the green to bluish represent XCO obtained with method II. The uncertainty of each bin is given by the colour scale and the error bars represent the standard error (![]() ). Red and blue dotted lines refer to the mean XCO obtained using methods I and II, respectively. The solid black line shows the Galactic value, while the two black dotted lines show 2.5 times the Galactic value, respectively.
). Red and blue dotted lines refer to the mean XCO obtained using methods I and II, respectively. The solid black line shows the Galactic value, while the two black dotted lines show 2.5 times the Galactic value, respectively.
Current usage metrics show cumulative count of Article Views (full-text article views including HTML views, PDF and ePub downloads, according to the available data) and Abstracts Views on Vision4Press platform.
Data correspond to usage on the plateform after 2015. The current usage metrics is available 48-96 hours after online publication and is updated daily on week days.
Initial download of the metrics may take a while.