Fig. E.1.
Download original image
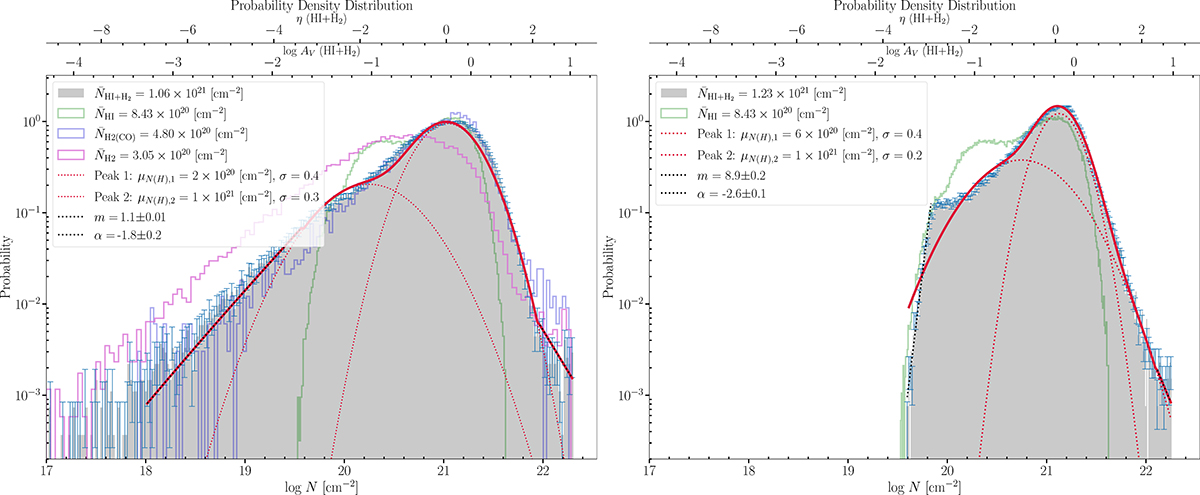
N-PDFs obtained from the various column density maps. Left: N-PDF of the high-res NH column density map derived using all Herschel dust data employing method I. Right: N-PDF of the NH column density map derived with method II. In solid red and dotted lines, the two-component log-normal fit is shown, whereas the power-law fits regimes are depicted in black dotted lines. The green lines show the N-PDF of H I. Here, m refers to the slope of the error tail for low column density, while α denotes the slope of the power-law tail for higher column densities. η is defined by ![]() , where N is the column density and ⟨N⟩ the mean column density. μ and σ refer to the peak and width of the fitted log-normals, respectively. See Appendix E for more details.
, where N is the column density and ⟨N⟩ the mean column density. μ and σ refer to the peak and width of the fitted log-normals, respectively. See Appendix E for more details.
Current usage metrics show cumulative count of Article Views (full-text article views including HTML views, PDF and ePub downloads, according to the available data) and Abstracts Views on Vision4Press platform.
Data correspond to usage on the plateform after 2015. The current usage metrics is available 48-96 hours after online publication and is updated daily on week days.
Initial download of the metrics may take a while.