Open Access
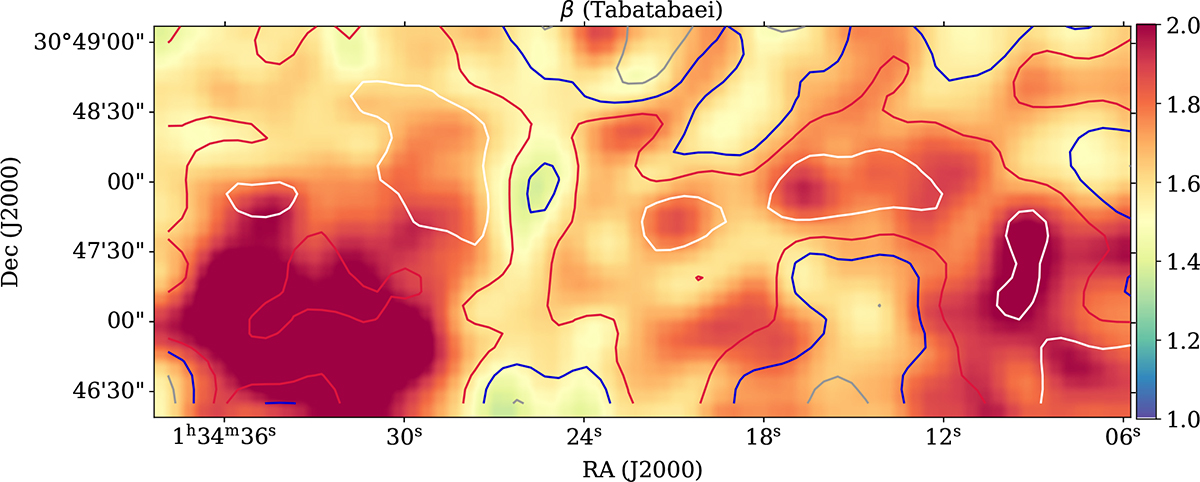
Fig. D.1.
Download original image
β map obtained by Tabatabaei et al. (2014) around NGC604 including areas of atomic and molecular phases. The contour lines represent the differences between our additional fit and the one of Tabatabaei et al. (2014), with values of −0.1, 0, 0.1 and 0.2 shown in white, red, blue and grey, respectively.
Current usage metrics show cumulative count of Article Views (full-text article views including HTML views, PDF and ePub downloads, according to the available data) and Abstracts Views on Vision4Press platform.
Data correspond to usage on the plateform after 2015. The current usage metrics is available 48-96 hours after online publication and is updated daily on week days.
Initial download of the metrics may take a while.